USA April 2026: Accord helps Honda up, sales off -6.7%
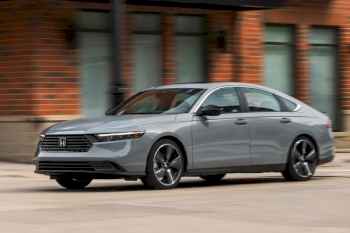
 Honda Accord sales are up 42.5% and tilt the brand into positive.
Three factors have combined to trigger the 4th consecutive year-on-year market decline in the US at -6.7% to 1,367,000 units according to GlobalData. First, April 2025 was propped by a pre-tariff rush that lifted the market by 10%. Second, the loss of federal electric vehicle tax credits have depleted the market for BEVs and third, record high petrol prices have degraded affordability further. The SAAR stands at 16.1 million according to Motor Intelligence, down from 17.2 million in April 2025 and 16.3 million last month.
Illustrating the impact of tariffs, Imports are down 16% for the month and -9.9% year-to-date whereas vehicles produced in North America fall just -3.9% in April and -3.5% year-to-date. Manufacturers are doing their best to counter affordability pressure. According to JD Power and GlobalData, the average incentives on non-EV vehicles stands at $2,860, a whopping 16% more than April 2025. Meanwhile average EV incentives are significantly higher at $10,018, however down -1.7% on a year ago.
All OEMs reporting monthly data are down. American Honda resists best at -0.2% while Hyundai-Kia is at -2.1% and Toyota Motor at -4.6%. Brand-wise, Honda (+1.6%) and Genesis (+0.8%) are the only ones reporting in positive. Hyundai (-1.7%), Toyota (-1.9%), Kia (-2.8%) and Subaru (-5.9%) contain their loss even though this is Subaru’s 9th consecutive month of YoY declines. In contrast Ford (-14.1%), Acura (-15.6%), Mazda (-17.3%), Lexus (-19.9%) and Lincoln (-21.4%) all struggle.
The Ford F-Series remains the dominant force in the market but falls a stark -14.7% year-on-year, in line with the -15.7% it lost so far in 2026. The Honda CR-V (+2.9%) smashes its archenemy the Toyota RAV4 (-32.8%) by almost 15,000 sales and extends its YTD advantage to a probably insurmountable 54,000 units. In a mini sedan revival, the Toyota Camry (+17.9%) and Corolla (+12.6%) surprise with double-digit gains while the Honda Civic (+6.3%) is more measured but still in positive. Excellent results for the Honda Accord (+42.5%), Ford Transit (+22%) and Bronco (+18.6%).
Previous month: USA March/Q1 2026: March sales down -14%, Ram (+20.1%) back in shape, Hyundai and Kia hit records
One year ago: USA April 2025: Pre-tariff rush lifts market up 10%
Full April 2026 data for selected OEMs, brands and models below.
Note: this dataset only includes OEMs, brands and models with available monthly data. It excludes those who report quarterly.
USA April 2026 – OEMs:
| OEM | Apr-26 | /25 | 2026 1-4 | 2026 1-2 | /25 |
| Toyota Motor | 222,377 | – 4.6% | 710,845 | 357,803 | + 5.6% |
| Ford Motor Co | 177,634 | – 14.5% | 609,008 | 283,794 | – 5.3% |
| Hyundai-Kia | 159,216 | – 2.1% | 463,694 | 262,708 | + 6.3% |
| American Honda | 137,405 | – 0.2% | 342,793 | 206,756 | + 1.5% |
| Subaru | 52,733 | – 5.9% | 259,748 | 87,270 | – 8.6% |
| Mazda | 31,128 | – 17.3% | 173,072 | 62,455 | – 7.1% |
USA April 2026 – brands:
| Brand | Apr-26 | /25 | 2026 1-4 | 2026 1-2 | /25 |
| Toyota | 194,190 | – 1.9% | 682,658 | 305,862 | + 5.1% |
| Ford | 168,507 | – 14.1% | 599,881 | 269,114 | – 6.1% |
| Honda | 125,571 | + 1.6% | 430,049 | 186,801 | + 0.6% |
| Hyundai | 80,157 | – 1.7% | 285,545 | 121,301 | + 4.1% |
| Kia | 72,703 | – 2.8% | 279,718 | 130,507 | + 8.5% |
| Subaru | 52,733 | – 5.9% | 194,677 | 87,270 | – 8.6% |
| Mazda | 31,128 | – 17.3% | 125,601 | 62,455 | – 7.1% |
| Lexus | 28,187 | – 19.9% | 109,139 | 51,941 | + 8.3% |
| Acura | 11,834 | – 15.6% | 44,186 | 19,955 | + 10.8% |
| Lincoln | 9,127 | – 21.4% | 32,737 | 14,680 | + 11.0% |
| Genesis | 6,356 | + 0.8% | 24,673 | 10,900 | + 4.8% |
USA April 2026 – models:
| Model | Apr-26 | /25 | 2026 1-4 | /25 |
| Ford F-Series | 62,048 | – 14.7% | 221,949 | – 15.7% |
| Honda CR-V | 42,677 | + 2.9% | 142,114 | – 1.9% |
| Toyota Camry | 33,419 | + 17.9% | 111,674 | + 13.2% |
| Toyota RAV4 | 28,212 | – 32.8% | 88,081 | – 44.0% |
| Toyota Corolla | 25,312 | + 12.6% | 87,886 | + 12.8% |
| Honda Civic | 25,040 | + 6.3% | 82,640 | + 0.1% |
| Toyota Tacoma | 24,777 | + 7.6% | 94,040 | + 13.5% |
| Hyundai Tucson | 22,024 | – 0.1% | 77,450 | + 0.5% |
| Ford Explorer | 21,191 | + 1.0% | 82,578 | + 20.9% |
| Subaru Forester | 17,837 | – 7.7% | 71,989 | + 4.0% |
| Ford Bronco | 17,073 | + 18.6% | 48,270 | + 2.7% |
| Honda Accord | 16,071 | + 42.5% | 53,388 | + 27.5% |
| Kia Sportage | 15,803 | – 2.3% | 60,507 | + 5.3% |
| Subaru Crosstrek | 15,667 | + 4.9% | 54,164 | – 7.5% |
| Ford Transit | 15,049 | + 22.0% | 49,297 | + 5.1% |
| Hyundai Elantra | 14,778 | + 12.6% | 47,841 | + 2.6% |
| Toyota Tundra | 14,334 | + 2.2% | 48,950 | – 1.3% |
| Ford Maverick | 14,196 | – 29.7% | 48,057 | – 17.4% |
| Toyota Grand Highlander | 14,096 | + 6.0% | 48,703 | + 24.8% |
| Kia K4 | 13,214 | + 0.9% | 50,434 | + 0.7% |
| Kia Telluride | 12,577 | + 15.8% | 48,505 | + 19.2% |
| Honda HR-V | 12,264 | – 11.8% | 43,281 | – 21.1% |
| Toyota 4Runner | 11,929 | + 28.8% | 45,173 | + 155.3% |
| Hyundai Palisade | 11,324 | + 7.8% | 39,028 | + 6.2% |
| Honda Pilot | 11,156 | – 8.2% | 42,649 | – 4.8% |
| Toyota Corolla Cross | 11,042 | + 13.1% | 41,135 | + 21.4% |
| Subaru Outback | 10,552 | – 8.3% | 37,626 | – 26.8% |
| Ford Bronco Sport | 10,516 | – 11.5% | 45,537 | + 0.6% |
| Mazda CX-5 | 10,206 | – 18.9% | 45,198 | – 3.8% |
| Lexus RX | 9,657 | – 13.8% | 38,993 | + 8.6% |
| Toyota Sienna | 9,448 | – 8.4% | 34,100 | + 0.7% |
| Kia Sorento | 9,109 | – 5.7% | 30,619 | – 12.0% |
| Hyundai Santa Fe | 9,058 | – 27.1% | 42,401 | – 3.2% |
| Mazda CX-50 | 8,201 | + 5.8% | 37,235 | + 19.9% |
| Honda Odyssey | 7,449 | – 23.0% | 25,924 | – 18.4% |
| Hyundai Sonata | 7,105 | + 18.2% | 21,652 | – 0.7% |
| Ford Expedition | 6,751 | – 39.3% | 24,305 | – 1.2% |
| Hyundai Kona | 6,706 | – 15.3% | 24,097 | – 3.3% |
| Kia K5 | 6,537 | + 4.6% | 25,343 | + 15.2% |
| Toyota Highlander | 6,456 | + 2.9% | 22,239 | + 21.6% |
| Kia Carnival | 6,389 | – 0.2% | 25,020 | + 19.3% |
| Ford Mustang | 5,830 | + 18.4% | 19,904 | + 39.2% |
| Lexus NX | 5,524 | – 21.9% | 18,743 | – 25.2% |
| Honda Passport | 5,447 | – 0.2% | 19,492 | + 13.6% |
| Kia Seltos | 5,335 | + 31.7% | 20,034 | + 29.9% |
| Ford Ranger | 5,245 | – 25.1% | 23,020 | + 5.0% |
| Ford Escape | 5,050 | – 60.9% | 17,447 | – 65.3% |
| Lexus TX | 4,878 | + 0.0% | 17,367 | + 16.4% |
| Acura MDX | 4,211 | – 0.4% | 15,139 | + 1.8% |
| Lincoln Nautilus | 4,135 | + 7.7% | 11,812 | – 5.5% |
| Mazda CX-30 | 4,067 | – 35.0% | 11,965 | – 56.2% |
| Hyundai Ioniq 5 | 3,603 | + 5.6% | 13,393 | + 11.4% |
| Honda Ridgeline | 3,602 | – 15.7% | 14,582 | – 4.2% |
| Subaru Ascent | 3,472 | – 7.6% | 12,647 | – 14.8% |
| Mazda CX-90 | 3,286 | – 39.2% | 12,365 | – 39.8% |
| Mazda3 | 3,235 | – 0.0% | 12,544 | – 0.3% |
| Toyota Land Cruiser | 3,226 | – 28.7% | 11,309 | – 43.3% |
| Toyota BZ/bZ4X | 3,001 | + 182.0% | 13,030 | + 95.2% |
| Lexus IS | 2,998 | + 51.1% | 8,043 | + 18.9% |
| Ford E-Series | 2,888 | – 21.9% | 12,247 | – 8.5% |
| Genesis GV70 | 2,837 | + 7.7% | 11,071 | + 12.6% |
| Ford Mustang Mach-E | 2,670 | – 8.8% | 7,270 | – 50.0% |
| Hyundai Venue | 2,610 | + 5.8% | 9,371 | + 9.9% |
| Acura Integra | 2,591 | + 27.1% | 8,468 | + 26.0% |
| Acura RDX | 2,538 | – 32.2% | 9,210 | – 27.3% |
| Toyota Sequoia | 2,418 | – 7.1% | 8,800 | + 14.2% |
| Acura ADX | 2,403 | + 147.7% | 10,267 | + 794.3% |
| Toyota Prius | 2,301 | – 66.4% | 12,038 | – 48.8% |
| Genesis GV80 | 2,128 | – 5.1% | 8,504 | + 4.2% |
| Lincoln Aviator | 2,053 | – 26.5% | 8,319 | + 10.0% |
| Toyota Crown Signia | 2,002 | + 4.8% | 7,295 | – 25.7% |
| Hyundai Santa Cruz | 1,885 | – 24.4% | 6,429 | – 29.7% |
| Lexus GX | 1,868 | – 52.8% | 10,433 | – 21.0% |
| Lincoln Navigator | 1,600 | – 41.7% | 5,922 | – 13.0% |
| Honda Prologue | 1,508 | – 18.4% | 4,827 | – 57.7% |
| Kia Niro | 1,491 | – 36.6% | 8,946 | + 19.8% |
| Subaru Impreza | 1,444 | – 43.6% | 5,356 | – 48.8% |
| Kia EV9 | 1,349 | + 481.5% | 4,089 | + 2.5% |
| Lincoln Corsair | 1,339 | – 40.1% | 6,684 | – 21.1% |
| Lexus RZ | 1,214 | + 86.5% | 5,670 | + 169.4% |
| Subaru WRX | 1,178 | + 52.6% | 4,680 | – 16.4% |
| Mazda MX-5 Miata | 1,163 | + 60.0% | 2,858 | – 9.9% |
| Subaru Solterra | 1,128 | + 18.9% | 4,169 | + 2.2% |
| Lexus UX | 1,110 | + 19.6% | 3,393 | – 1.7% |
| Genesis G70 | 991 | + 23.4% | 3,410 | + 7.3% |
| Mazda CX-70 | 970 | – 42.6% | 3,436 | – 45.6% |
| Hyundai Ioniq 9 | 866 | new | 2,856 | new |
| Kia EV6 | 728 | + 11.0% | 2,751 | – 37.4% |
| Toyota Crown | 721 | – 26.4% | 3,662 | + 13.9% |
| Lexus LX | 636 | – 17.1% | 2,484 | + 0.5% |
| Toyota C-HR | 632 | n/a | 645 | n/a |
| Subaru Uncharted | 519 | new | 522 | new |
| Toyota GR86 | 496 | – 49.9% | 2,542 | – 32.5% |
| Subaru Trailseeker | 406 | new | 409 | new |
| Honda Prelude | 357 | new | 1,152 | new |
| Toyota Supra | 344 | + 94.4% | 1,263 | + 111.2% |
| Subaru BRZ | 283 | – 14.5% | 1,086 | – 4.1% |
| Genesis G80 | 282 | – 6.6% | 1,141 | – 8.1% |
| Subaru Legacy | 247 | – 86.8% | 2,035 | – 73.5% |
| Hyundai Ioniq 6 | 198 | – 82.1% | 1,027 | – 76.8% |
| Lexus ES | 183 | – 94.6% | 3,227 | – 74.3% |
| Kia Soul | 171 | – 96.6% | 3,470 | – 78.8% |
| Lexus LC | 92 | – 10.7% | 416 | – 33.1% |
| Genesis GV60 | 89 | – 53.6% | 206 | – 77.7% |
| Acura TLX | 81 | – 88.6% | 1,019 | – 54.5% |
| Genesis G90 | 29 | – 75.0% | 341 | – 25.5% |
| Lexus RC | 26 | – 80.7% | 226 | – 61.5% |
| Toyota Mirai | 23 | + 2200.0% | 86 | + 152.9% |
| Acura ZDX | 10 | – 99.6% | 83 | – 98.8% |
| Lexus LS | 1 | – 99.1% | 144 | – 72.9% |
| Toyota Venza | 1 | – 90.9% | 5 | – 99.3% |
| Toyota Avalon | 0 | – 100.0% | 2 | + 0.0% |
Source: Manufacturers