Hungary June 2025: Skoda Octavia and Dacia Duster on top
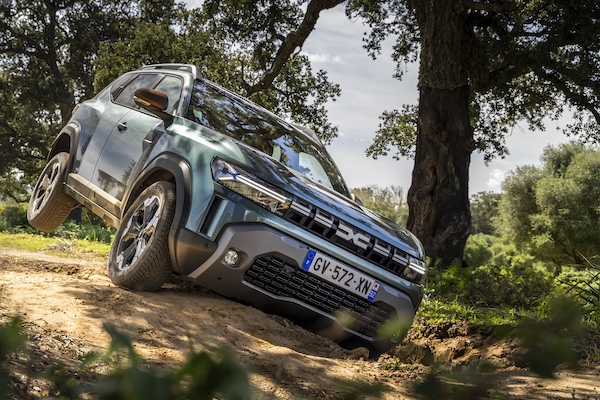 Dacia Duster sales are up 48.9% year-on-year in Hungary.
11,511 new passenger cars hit Hungarian roads in June, a small -1.8% drop, leading to a H1 2025 tally up 4.2% to 66,095. Toyota threepeats at #1 with a round 10% share, ahead of Skoda at 8.5%. YTD leader Suzuki is down to third place with just 8.2% share vs. 11.2% so far this year. Volkswagen is back up three spots on last month to #4, distancing Ford, Kia and BMW. Dacia and Renault are both up two ranks to #9 and #10 respectively while Opel is up four to #12. Tesla is up five to #14 with 2.7% share vs. 1.7% over H1. Nissan freefalls 12 spots to #18. Citroen advances to #18 just as BYD returns inside the Top 20 at #20.
In the passenger cars models ranking, there are no Suzukis in the Top 2 for the 2nd month in a row. The Skoda Octavia (+15%) repeats in pole position with a dominant 4.3% share, that’s however below the 4.7% it commands year-to-date. The Dacia Duster (+48.9%) soars four spots on May to #2 with 3.4% share vs. #6 and 2.3% over H1. Still leader YTD, the Suzuki S-Cross (-19.6%) is stuck in third place while the Suzuki Vitara (-32.4%) is in ever poorer shape at #4. The Kia Ceed (-16.5%) is also in a bad way at #5 but climbs 14% year-to-date. Excellent performances also by the Tesla Model Y (+200%), Suzuki Swift (+124.8%), Toyota Corolla (+51.2%) and Ford Tourneo Custom (+24.4%).
Previous month: Hungary May 2025: Skoda Octavia and Nissan Qashqai push Suzukis down
One year ago: Hungary June/H1 2024: MG ZS, Ford Transit Custom impress, sales up 14.1%
Full June 2025 Top 20 brands and Top 10 models and H1 2025 Top 20 models below.
Hungary June 2025 – brands (PC only):
| Pos | Brand PC only | Jun-25 | % | May | H1 2025 | % | Pos | FY24 |
| 1 | Toyota | 1,146 | 10.0% | 1 | 7,009 | 10.6% | 2 | 2 |
| 2 | Skoda | 982 | 8.5% | 3 | 5,862 | 8.9% | 3 | 3 |
| 3 | Suzuki | 948 | 8.2% | 2 | 7,431 | 11.2% | 1 | 1 |
| 4 | Volkswagen | 911 | 7.9% | 7 | 4,666 | 7.1% | 5 | 4 |
| 5 | Ford | 749 | 6.5% | 4 | 4,812 | 7.3% | 4 | 5 |
| 6 | Kia | 737 | 6.4% | 5 | 4,241 | 6.4% | 6 | 6 |
| 7 | BMW | 602 | 5.2% | 8 | 3,286 | 5.0% | 8 | 7 |
| 8 | Mercedes | 569 | 4.9% | 9 | 2,757 | 4.2% | 9 | 9 |
| 9 | Dacia | 522 | 4.5% | 11 | 2,131 | 3.2% | 11 | 11 |
| 10 | Renault | 486 | 4.2% | 12 | 1,996 | 3.0% | 12 | 13 |
| 11 | Hyundai | 421 | 3.7% | 10 | 2,443 | 3.7% | 10 | 10 |
| 12 | Opel | 363 | 3.2% | 16 | 1,451 | 2.2% | 14 | 12 |
| 13 | Peugeot | 323 | 2.8% | 13 | 1,394 | 2.1% | 16 | 17 |
| 14 | Tesla | 312 | 2.7% | 19 | 1,097 | 1.7% | 17 | 16 |
| 15 | Audi | 303 | 2.6% | 14 | 1,738 | 2.6% | 13 | 15 |
| 16 | Volvo | 261 | 2.3% | 15 | 1,433 | 2.2% | 15 | 14 |
| 17 | MG | 212 | 1.8% | 17 | 835 | 1.3% | 19 | 19 |
| 18 | Nissan | 188 | 1.6% | 6 | 3,578 | 5.4% | 7 | 8 |
| 19 | Citroen | 171 | 1.5% | 20 | n/a | n/a | n/a | n/a |
| 20 | BYD | 151 | 1.3% | n/a | 872 | 1.3% | 18 | 22 |
| n/a | SsangYong | 108 | 0.9% | n/a | 766 | 1.2% | 20 | 18 |
Hungary June 2025 – models (PC only):
| Pos | Model | Jun-25 | % | /24 | May | H1 2025 | % | /24 | Pos | FY24 |
| 1 | Skoda Octavia | 491 | 4.3% | + 15.0% | 1 | 3,077 | 4.7% | – 6.6% | 2 | 3 |
| 2 | Dacia Duster | 396 | 3.4% | + 48.9% | 6 | 1,535 | 2.3% | – 5.0% | 6 | 7 |
| 3 | Suzuki S-Cross | 358 | 3.1% | – 19.6% | 3 | 3,289 | 5.0% | + 3.3% | 1 | 2 |
| 4 | Suzuki Vitara | 340 | 3.0% | – 32.4% | 4 | 2,839 | 4.3% | – 33.7% | 3 | 1 |
| 5 | Kia Ceed | 268 | 2.3% | – 16.5% | 5 | 1,844 | 2.8% | + 14.0% | 5 | 5 |
| 6 | Toyota Corolla | 257 | 2.2% | + 51.2% | 10 | 1,351 | 2.0% | – 16.1% | 8 | 6 |
| 7 | Tesla Model Y | 252 | 2.2% | + 200.0% | 30 | 754 | 1.1% | – 5.5% | 18 | 30 |
| 8 | Suzuki Swift | 236 | 2.1% | + 124.8% | 12 | 1,149 | 1.7% | + 37.8% | 11 | 17 |
| 9 | Toyota C-HR | 206 | 1.8% | + 6.7% | 16 | 1,147 | 1.7% | – 10.0% | 12 | 9 |
| 10 | Ford Tourneo Custom | 194 | 1.7% | + 24.4% | 15 | 1,475 | 2.2% | + 171.1% | 7 | 22 |
Hungary H1 2025 – models (PC only):
| Pos | Model | H1 2025 | % | /24 | FY24 |
| 1 | Suzuki S-Cross | 3,289 | 5.0% | + 3.3% | 2 |
| 2 | Skoda Octavia | 3,077 | 4.7% | – 6.6% | 3 |
| 3 | Suzuki Vitara | 2,839 | 4.3% | – 33.7% | 1 |
| 4 | Nissan Qashqai | 2,286 | 3.5% | + 21.8% | 4 |
| 5 | Kia Ceed | 1,844 | 2.8% | + 14.0% | 5 |
| 6 | Dacia Duster | 1,535 | 2.3% | – 5.0% | 7 |
| 7 | Ford Tourneo Custom | 1,475 | 2.2% | + 171.1% | 22 |
| 8 | Toyota Corolla | 1,351 | 2.0% | – 16.1% | 6 |
| 9 | Toyota Yaris Cross | 1,212 | 1.8% | + 12.1% | 12 |
| 10 | Kia Sportage | 1,190 | 1.8% | + 36.8% | 14 |
| 11 | Suzuki Swift | 1,149 | 1.7% | + 37.8% | 17 |
| 12 | Toyota C-HR | 1,147 | 1.7% | – 10.0% | 9 |
| 13 | VW Golf | 1,091 | 1.7% | – 12.7% | 15 |
| 14 | Toyota Corolla Cross | 931 | 1.4% | + 28.4% | 20 |
| 15 | Ford Puma | 922 | 1.4% | + 22.3% | 24 |
| 16 | Nissan X-Trail | 835 | 1.3% | + 43.0% | 25 |
| 17 | Hyundai Tucson | 776 | 1.2% | – 16.3% | 19 |
| 18 | Tesla Model Y | 754 | 1.1% | – 5.5% | 30 |
| 19 | Skoda Kodiaq | 751 | 1.1% | + 26.4% | 26 |
| 20 | Ford Kuga | 739 | 1.1% | + 1.0% | 13 |
Source: Datahouse. Many thanks to Csaba