Taiwan April 2026: Toyota RAV4, Mercedes CLA among best performers
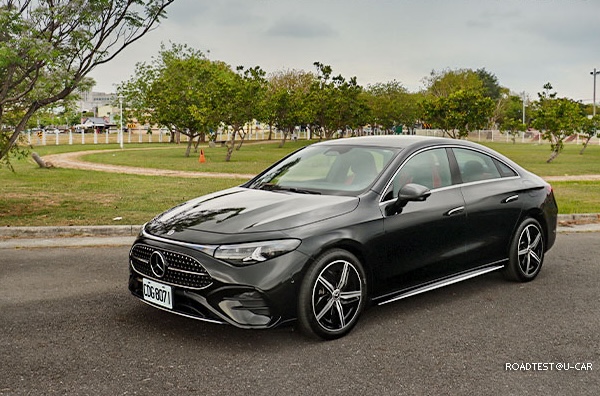 The Mercedes CLA is up to #14 in Taiwan in April.
New car sales in Taiwan skid -4.5% year-on-year in April to 31,407 units, leading to a year-to-date tally down -3.7% to 127,841. Toyota (+3.2%) defies the negative trend with a small uptick to reach 32.8% share vs. 31.1% so far this year. Lexus (-13.4%) is back up two spots on last month to its traditional 2nd place with 6.8% share, while CMC (-18.1%) is also up two to #3 despite a drab YoY evolution. The same goes for Mercedes (-21.8%) up six ranks to #4 but freefalling YoY. Mazda (+67.4%), Mitsubishi (+37.3%) and Ford (+33.9%) all go against the market with splendid YoY gains. Tesla (-95.7%) goes from 5,421 sales and 13.9% share in March (#2) to just 7 sales this month.
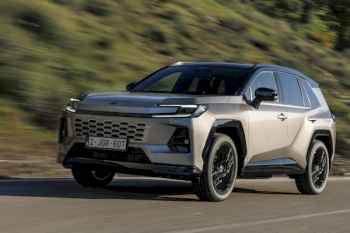
Model-wise, the Toyota Corolla Cross (+11.6%) reclaims the top spot at 11.4% share with the Toyota RAV4 (+24.7%) back in great shape at #2. The CMC J Space (-16.8%) rounds out the podium but suffers from a particularly high year-ago comparison base. The new Ford Territory confirms it is an instant blockbuster by reaching a record 4th place, also hit last February. The Honda HR-V (+64.4%) also shines at #8, with the Nissan Kicks (+39.9%) just missing out on a first Top 10 finish in 3 years at #11. The Mercedes CLA (+535.6%) surges to #14 thanks to the new generation.
Previous month: Taiwan March 2026: Tesla Model Y takes the lead with 11.6% share
One year ago: Taiwan April 2025: Sales down -11.2%, CMC J Space up to record #2
Full April 2026 Top 10 brands and Top 70 models below.
Taiwan April 2026 – brands:
| Pos | Brand | Apr-26 | % | /25 | Mar | 2026 | % | /24 | Pos | FY25 |
| 1 | Toyota | 10,305 | 32.8% | + 3.2% | 1 | 39,788 | 31.1% | – 6.2% | 1 | 1 |
| 2 | Lexus | 2,144 | 6.8% | – 13.4% | 4 | 9,070 | 7.1% | – 18.2% | 2 | 2 |
| 3 | CMC | 1,869 | 6.0% | – 18.1% | 5 | 7,294 | 5.7% | – 16.7% | 4 | 3 |
| 4 | Mercedes | 1,834 | 5.8% | – 21.8% | 10 | 6,097 | 4.8% | – 34.5% | 5 | 5 |
| 5 | Ford | 1,536 | 4.9% | + 33.9% | 8 | 5,970 | 4.7% | + 42.6% | 6 | n/a |
| 6 | Hyundai | 1,417 | 4.5% | – 18.2% | 9 | 5,467 | 4.3% | – 3.6% | 7 | 6 |
| 7 | Mitsubishi | 1,405 | 4.5% | + 37.3% | 7 | 5,436 | 4.3% | + 28.7% | 9 | 10 |
| 8 | BMW | 1,297 | 4.1% | – 31.6% | n/a | 3,943 | 3.1% | – 30.8% | n/a | 7 |
| 9 | Honda | 1,108 | 3.5% | – 24.1% | 3 | 7,989 | 6.2% | + 19.4% | 3 | 4 |
| 10 | Mazda | 1,075 | 3.4% | + 67.4% | 6 | 4,373 | 3.4% | + 14.9% | 10 | 9 |
| n/a | Suzuki | 780 | 2.5% | + 2.8% | n/a | n/a | n/a | n/a | n/a | n/a |
| n/a | Kia | 728 | 2.3% | – 28.7% | n/a | 2,548 | 2.0% | – 28.6% | n/a | n/a |
| n/a | Tesla | 7 | 0.0% | – 95.7% | 2 | 5,439 | 4.3% | + 94.3% | 8 | 8 |
Taiwan April 2026 – models:
| Pos | Model | Apr-26 | % | /25 | Mar | 2026 | % | /24 | Pos | FY25 |
| 1 | Toyota Corolla Cross | 3,573 | 11.4% | + 11.6% | 2 | 14,183 | 11.1% | + 3.3% | 1 | 1 |
| 2 | Toyota RAV4 | 2,028 | 6.5% | + 24.7% | 3 | 7,709 | 6.0% | + 3.3% | 2 | 2 |
| 3 | CMC J Space | 1,404 | 4.5% | – 16.8% | 4 | 5,317 | 4.2% | – 14.6% | 3 | 3 |
| 4 | Ford Territory | 1,294 | 4.1% | new | 5 | 4,722 | 3.7% | new | 4 | 63 |
| 5 | Toyota Yaris Cross | 1,129 | 3.6% | – 1.7% | 8 | 4,083 | 3.2% | – 26.2% | 7 | 5 |
| 6 | Toyota Town Ace | 1,075 | 3.4% | – 29.3% | 6 | 3,924 | 3.1% | – 32.8% | 8 | 4 |
| 7 | Lexus NX | 959 | 3.1% | + 0.7% | 10 | 4,227 | 3.3% | – 3.5% | 6 | 7 |
| 8 | Honda HR-V | 791 | 2.5% | + 64.4% | 9 | 3,631 | 2.8% | + 106.7% | 9 | 9 |
| 9 | Toyota Corolla Altis | 641 | 2.0% | + 3.7% | 14 | 2,529 | 2.0% | – 18.7% | 11 | 8 |
| 10 | Mitsubishi Delica | 554 | 1.8% | – 10.6% | 13 | 2,006 | 1.6% | – 11.0% | 13 | 11 |
| 11 | Nissan Kicks | 515 | 1.6% | + 39.9% | 18 | 1,664 | 1.3% | + 19.6% | 17 | 17 |
| 12 | Lexus RX | 503 | 1.6% | + 6.8% | 15 | 2,032 | 1.6% | – 8.4% | 12 | 14 |
| 13 | Mitsubishi Xforce | 468 | 1.5% | new | 20 | 1,970 | 1.5% | new | 14 | n/a |
| 14 | Mercedes CLA Class | 464 | 1.5% | + 535.6% | n/a | 595 | 0.5% | + 134.3% | 45 | 65 |
| 15 | Toyota Camry | 450 | 1.4% | – 13.3% | 16 | 1,696 | 1.3% | + 27.1% | 16 | 25 |
| 16 | Suzuki Swift | 431 | 1.4% | + 77.4% | 38 | 1,067 | 0.8% | + 5.6% | 26 | 28 |
| 17 | Mercedes GLC Class | 414 | 1.3% | – 40.5% | 26 | 1,557 | 1.2% | – 51.4% | 19 | 12 |
| 18 | Toyota bZ4X | 381 | 1.2% | n/a | 17 | 1,638 | 1.3% | n/a | 18 | n/a |
| 19 | Hyundai Porter | 373 | 1.2% | – 2.1% | 25 | 1,303 | 1.0% | + 3.2% | 22 | 23 |
| 20 | BMW X3 | 359 | 1.1% | + 20.9% | 35 | 916 | 0.7% | + 118.1% | 34 | n/a |
| 21 | CMC Zinger | 341 | 1.1% | – 29.0% | 24 | 1,470 | 1.1% | – 30.5% | 20 | 15 |
| 22 | Foxtron Bria | 321 | 1.0% | new | 21 | 1,131 | 0.9% | new | 24 | – |
| 23 | Mazda CX-5 | 320 | 1.0% | + 267.8% | 11 | 1,712 | 1.3% | + 54.7% | 15 | 13 |
| 24 | Lexus UX | 313 | 1.0% | – 15.4% | 23 | 1,062 | 0.8% | – 37.4% | 27 | 18 |
| 25 | Toyota Vios | 292 | 0.9% | – 13.6% | 28 | 1,266 | 1.0% | – 21.4% | 23 | 22 |
| 26 | Hyundai Venue | 267 | 0.9% | – 11.0% | 32 | 1,022 | 0.8% | – 7.1% | 28 | 31 |
| 27 | Mazda3 | 257 | 0.8% | + 46.9% | 29 | 752 | 0.6% | – 23.0% | 37 | 33 |
| 28 | Honda Fit | 247 | 0.8% | – 17.1% | 22 | 1,426 | 1.1% | – 7.8% | 21 | 21 |
| 29 | Hyundai Custin | 237 | 0.8% | – 16.3% | 31 | 1,090 | 0.9% | – 11.9% | 25 | 30 |
| 30 | Suzuki Jimny | 232 | 0.7% | – 17.7% | 30 | 984 | 0.8% | n/a | 30 | n/a |
| 31 | Mazda CX-60 | 227 | 0.7% | n/a | n/a | n/a | n/a | n/a | n/a | 54 |
| 32 | Nissan Sentra | 227 | 0.7% | – 22.0% | 27 | 990 | 0.8% | – 7.6% | 29 | 32 |
| 33 | Nissan X-Trail | 227 | 0.7% | + 36.7% | 43 | 947 | 0.7% | – 20.2% | 33 | 24 |
| 34 | Hyundai Tucson | 215 | 0.7% | – 57.9% | 34 | 796 | 0.6% | – 42.3% | 35 | 19 |
| 35 | Lexus LBX | 188 | 0.6% | – 23.9% | 33 | 779 | 0.6% | – 19.7% | 36 | 37 |
| 36 | MG G50 Plus | 186 | 0.6% | n/a | 37 | 967 | 0.8% | n/a | 31 | n/a |
| 37 | Mercedes E Class | 176 | 0.6% | – 41.7% | 53 | 666 | 0.5% | – 19.9% | 41 | 41 |
| 38 | Hyundai Mufasa | 173 | 0.6% | new | 40 | 732 | 0.6% | new | 39 | 40 |
| 39 | Mazda CX-30 | 173 | 0.6% | – 8.9% | 19 | 963 | 0.8% | + 10.9% | 32 | 35 |
| 40 | MG ZS | 169 | 0.5% | – 8.6% | 50 | 606 | 0.5% | + 111.1% | 43 | 47 |
| 41 | Kia Sportage | 158 | 0.5% | – 43.4% | 36 | 747 | 0.6% | – 31.3% | 38 | 27 |
| 42 | Fuso Canter | 155 | 0.5% | + 0.0% | 41 | 527 | 0.4% | – 32.4% | 46 | 39 |
| 43 | BMW X6 | 153 | 0.5% | n/a | n/a | n/a | n/a | n/a | n/a | n/a |
| 44 | Toyota Alphard | 151 | 0.5% | – 64.1% | 48 | 598 | 0.5% | – 51.3% | 44 | 29 |
| 45 | MG HS | 145 | 0.5% | – 41.5% | 42 | 625 | 0.5% | – 43.0% | 42 | 34 |
| 46 | Toyota Sienna | 144 | 0.5% | n/a | n/a | n/a | n/a | n/a | n/a | n/a |
| 47 | VW T-Roc | 142 | 0.5% | + 51.1% | 39 | n/a | n/a | n/a | n/a | n/a |
| 48 | Mercedes GLA Class | 139 | 0.4% | – 27.2% | n/a | n/a | n/a | n/a | n/a | 38 |
| 49 | Luxgen n7 | 138 | 0.4% | – 49.1% | 47 | 484 | 0.4% | – 65.2% | 49 | 26 |
| 50 | VW Tiguan | 137 | 0.4% | + 31.7% | 60 | 475 | 0.4% | n/a | n/a | n/a |
| 51 | Porsche Cayenne | 130 | 0.4% | n/a | 52 | 465 | 0.4% | n/a | n/a | n/a |
| 52 | CMC Veryca | 124 | 0.4% | + 6.9% | 56 | 507 | 0.4% | + 22.8% | 47 | 53 |
| 53 | Toyota Crown | 118 | 0.4% | + 122.6% | 55 | 498 | 0.4% | + 40.3% | 48 | 61 |
| 54 | Kia Picanto | 113 | 0.4% | – 46.4% | 46 | 413 | 0.3% | n/a | n/a | n/a |
| 55 | Skoda Octavia | 112 | 0.4% | – 39.8% | 51 | 482 | 0.4% | – 19.1% | 50 | 45 |
| 56 | Lexus LM | 107 | 0.3% | – 58.4% | 54 | 427 | 0.3% | – 54.0% | n/a | 42 |
| 57 | Kia Stonic | 105 | 0.3% | n/a | n/a | n/a | n/a | n/a | n/a | n/a |
| 58 | BMW 2 Series | 102 | 0.3% | – 49.3% | n/a | 339 | 0.3% | – 26.6% | n/a | 52 |
| 59 | Ford Kuga | 99 | 0.3% | – 83.0% | 44 | 451 | 0.4% | – 75.2% | n/a | 20 |
| 60 | Suzuki Carry | 96 | 0.3% | + 6.7% | 66 | n/a | n/a | n/a | n/a | n/a |
| 61 | Mitsubishi Colt Plus | 95 | 0.3% | – 26.4% | 49 | 470 | 0.4% | – 36.4% | n/a | 43 |
| 62 | Toyota Granvia+Hiace | 95 | 0.3% | – 22.1% | 69 | 275 | 0.2% | – 35.9% | n/a | n/a |
| 63 | VW Golf | 95 | 0.3% | n/a | 64 | 359 | 0.3% | n/a | n/a | n/a |
| 64 | Mercedes GLE Class | 94 | 0.3% | – 52.8% | n/a | n/a | n/a | n/a | n/a | 55 |
| 65 | BMW 1 Series | 91 | 0.3% | – 55.6% | 57 | 378 | 0.3% | – 39.8% | n/a | 50 |
| 66 | Volvo XC60 | 91 | 0.3% | n/a | 63 | 397 | 0.3% | n/a | n/a | n/a |
| 67 | BMW 3 Series | 90 | 0.3% | – 11.8% | n/a | n/a | n/a | n/a | n/a | 60 |
| 68 | Mercedes C Class | 82 | 0.3% | – 35.4% | 70 | 323 | 0.3% | – 34.1% | n/a | 59 |
| 69 | Mercedes V Class | 80 | 0.3% | – 62.1% | 62 | 374 | 0.3% | – 31.1% | n/a | 58 |
| 70 | Volvo EX30 | 76 | 0.2% | n/a | 65 | 331 | 0.3% | n/a | n/a | n/a |
Source: U-car.com.tw