Australia January 2026: Chinese (+62.9%) pull market up, Toyota (-22.3%) at lowest in 3 years
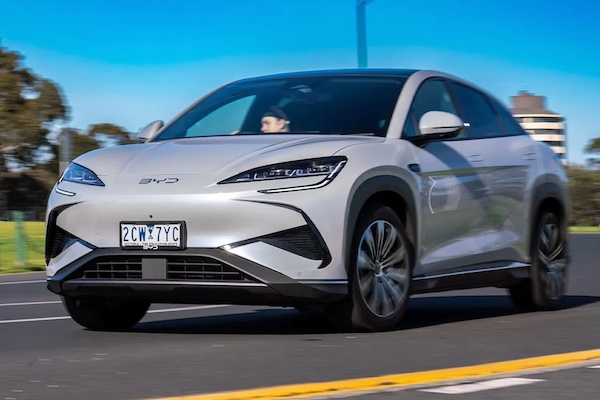 BYD sales are up 640.9% year-on-year in January.
New vehicle sales in Australia start the year in a timid way with a tiny +0.1% increase to 87,753 units. This is a counter performance as January 2025 sales were negatively impacted by a shipping port strike and biosecurity delays. Private sales edge up 0.5% to 44,150 while business sales drop -2.9% to 32,851 and short term rentals surge +47% to 5,258, denoting an artificial overall market growth. Government sales are off -11.7% to 2,364. Note this excludes Polestar, Tesla and heavy commercials. Excluding heavy commercials again, petrol sales are down -14.7% to 33,144, diesel is down a measured -3.7% to 24,439, HEV is up a shy 2% to 15,131 and we’ll see why shortly, BEVs shoot up 93.3% to 7,409 and 8.4% share (this is till below the 9.5% reached in January 2023. Finally PHEVs soar 170.5% to 5,161.
SUVs edge up 0.7% to 53,666 and 61.2% share vs. 60.8% in January 2025 and 55.5% two years ago, light commercials fall -2.5% to 17,0995 and 20.5% share vs. 21.1% last year and 22.9% in 2024, passenger cars bounce back up slightly at +4.2% to 13,623 and 15.5% share vs. 14.9% in January 2025 and 18.3% two years ago. Heavy commercials are up 2.8% to 2,469. Looking at sales by State and Territories (excluding Tesla and Polestar), three are in positive: Victoria up 6.3% to 24,222, New South Wales at +2.3% to 26,305 and Australian Capital Territory at +2% to 1,160. The rest suffer, with Northern Territory hit the hardest at -18.1% to 628, Western Australia off -12.7% to 8,952, South Australia down -3% to 5,619, Tasmania down -0.8% to 1,424 and Queensland off -0.7% to 18,782. As for country of origin, Japan is down -24.6% to 22,943, China up a tremendous 62.9% to 20,921 and 23.8% share vs. 14.7% a year ago (impacted by biosecurity delays in Australian ports), Thailand is down 7.7% to 17,072, South Korea up 3.6% to 11,277 and Germany up 20.5% to 4,346.
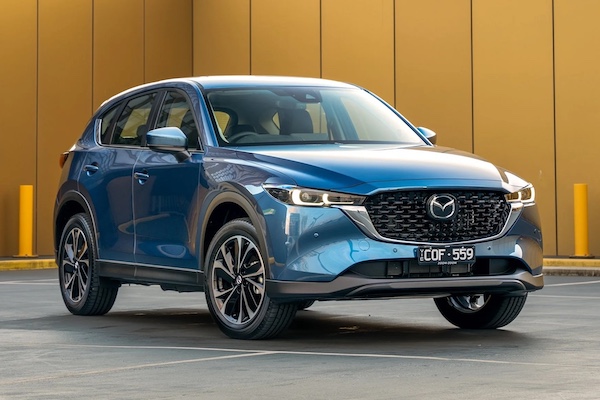 The Mazda CX-5 is on the Australian podium for the first time in four years.
It’s a month to forget for Toyota at -22.3% year-on-year to 14.1% share, its lowest in almost three years: since March 2023 (13.6%) which was affected by stock shortages and quarantine-related issues. Mazda (-7.6%) is traditionally stronger in January, but not this year: it holds 7.6% of the market, just above the 7.4% it commanded over the Full Year 2025. Kia (+15.4%) posts a splendid score and climbs to #3, a ranking it last reached last September. Ford (-10.5%) is relegated to 4th place while Hyundai (+6.9%) is solid and rounds out the Top 5. BYD (+640.9%) surges (year-ago volumes impacted by shipping issues) to #6 and #1 Chinese brand like last month. Fellow Chinese GWM (+31.3%) also impresses but Chery (+105.8%) hits a record monthly volume for the 12th consecutive time! It is also at its best ever share (3.7%). Geely (#22) and Omoda Jaecoo (#23) both hit record rankings. We welcome Chinese van-maker Farizon at #52 with its first 7 sales.
Over in the models charts, the Ford Ranger (-20%) reclaims the top spot despite a harsh year-on-year fall, it distances the Toyota Hilux (-15.2%) also hit hard as the new generation trickles into dealerships. The Mazda CX-5 (+22.3%) is the surprise of the month: although due to be renewed later this year, it delivers a record third place (also hit in August 2020 and January 2022) and #1 SUV, a spot it held for many years before being toppled by the Toyota RAV4. Talking of which, the RAV4 (-65.4%) collapses to #10 as stock of the outgoing generation is dwindling in the wake of the new model hitting dealerships in March. The RAV4 will surely fall further down over the next few months as there won’t be any additional shipments of the old gen. Meanwhile the Chery Tiggo 4 (+119.4%) is back to an all-time high #4 also hit last November, and the Mitsubishi Outlander (-5.5%) is back up six spots on last month to #5 despite a YoY loss. At #6, the Ford Everest (+13.9%) once again outsells its archenemy the Toyota Prado (-51.1%) down to #14. The Hyundai Kona (+41.4%) is back up to an outstanding #7, with the GWM Haval Jolion (+39.1%) also very strong at #9.
Previous post: Australia Full Year 2025: Record market, Ford Ranger threepeats at #1, BYD up to #4 in December
One year ago: Australia January 2025: Toyota RAV4 secures 7th win in a row in negative market
Full January 2026 Top 58 All brands and Top 20 models below.
Australia January 2026 – brands:
| Pos | Brand | Jan-26 | % | /25 | Dec |
| 1 | Toyota | 14,310 | 14.1% | – 22.3% | 1 |
| 2 | Mazda | 7,692 | 7.6% | – 7.6% | 3 |
| 3 | Kia | 6,600 | 6.5% | + 15.4% | 5 |
| 4 | Ford | 6,116 | 6.0% | – 10.5% | 2 |
| 5 | Hyundai | 5,856 | 5.8% | + 6.9% | 6 |
| 6 | BYD | 5,001 | 4.9% | + 640.9% | 4 |
| 7 | GWM | 4,509 | 4.4% | + 31.3% | 7 |
| 8 | Mitsubishi | 4,347 | 4.3% | – 23.5% | 8 |
| 9 | Chery | 3,780 | 3.7% | + 105.8% | 9 |
| 10 | MG | 3,123 | 3.1% | – 16.5% | 13 |
| 11 | Isuzu Ute | 2,929 | 2.9% | + 2.0% | 10 |
| 12 | Subaru | 2,336 | 2.3% | – 20.1% | 11 |
| 13 | BMW | 2,154 | 2.1% | + 53.7% | 14 |
| 14 | Mercedes | 2,149 | 2.1% | + 22.4% | 15 |
| 15 | Volkswagen | 1,886 | 1.9% | – 18.5% | 16 |
| 16 | Nissan | 1,871 | 1.8% | – 38.4% | 17 |
| 17 | Honda | 1,222 | 1.2% | – 3.0% | 20 |
| 18 | LDV | 960 | 0.9% | – 19.5% | 21 |
| 19 | Suzuki | 908 | 0.9% | – 36.5% | 22 |
| 20 | Audi | 856 | 0.8% | – 15.6% | 18 |
| 21 | Lexus | 855 | 0.8% | – 11.8% | 19 |
| 22 | Geely | 720 | 0.7% | new | 31 |
| 23 | Omoda Jaecoo | 691 | 0.7% | new | 25 |
| 24 | Tesla | 501 | 0.5% | – 32.2% | 12 |
| 25 | Zeekr | 469 | 0.5% | new | 30 |
| 26 | Volvo | 416 | 0.4% | – 25.7% | 24 |
| 27 | Porsche | 397 | 0.4% | – 15.2% | 32 |
| 28 | Mini | 395 | 0.4% | + 13.2% | 28 |
| 29 | Skoda | 342 | 0.3% | + 4.0% | 26 |
| 30 | Land Rover | 336 | 0.3% | – 17.0% | 23 |
| 31 | Renault | 300 | 0.3% | – 28.4% | 29 |
| 32 | Ram | 277 | 0.3% | + 12.6% | 34 |
| 33 | Chevrolet | 259 | 0.3% | – 19.6% | 27 |
| 34 | KGM | 208 | 0.2% | – 33.3% | 33 |
| 35 | Cupra | 200 | 0.2% | + 7.0% | 36 |
| 36 | Polestar | 160 | 0.2% | + 95.1% | 37 |
| 37 | Foton | 120 | 0.1% | new | 41 |
| 38 | Genesis | 119 | 0.1% | + 13.3% | 38 |
| 39 | JAC | 118 | 0.1% | – 42.2% | 39 |
| 40 | Deepal | 99 | 0.1% | new | 42 |
| 41 | Fiat | 97 | 0.1% | – 47.0% | 35 |
| 42 | Jeep | 66 | 0.1% | – 54.5% | 43 |
| 43 | Peugeot | 65 | 0.1% | – 39.3% | 40 |
| 44 | Leapmotor | 61 | 0.1% | + 177.3% | 44 |
| 45 | GMC | 39 | 0.0% | new | 46 |
| 46 | Alfa Romeo | 34 | 0.0% | + 0.0% | 45 |
| 47 | Maserati | 20 | 0.0% | – 16.7% | 52 |
| 48 | Ferrari | 18 | 0.0% | + 500.0% | 51 |
| 49 | Lamborghini | 12 | 0.0% | – 52.0% | 48 |
| 50 | Bentley | 12 | 0.0% | + 140.0% | 49 |
| 51 | Aston Martin | 7 | 0.0% | + 0.0% | 50 |
| 52 | Farizon | 7 | 0.0% | new | – |
| 53 | Rolls-Royce | 6 | 0.0% | + 20.0% | 55 |
| 54 | McLaren | 4 | 0.0% | + 100.0% | 54 |
| 55 | Jaguar | 3 | 0.0% | – 92.5% | 47 |
| 56 | Lotus | 1 | 0.0% | – 80.0% | 53 |
| 57 | Denza | 0 | 0.0% | new | 56 |
| 58 | Citroen | 0 | 0.0% | – 100.0% | – |
Australia January 2026 – models:
| Pos | Model | Jan-26 | % | /25 | Dec |
| 1 | Ford Ranger | 3,403 | 3.9% | – 20.0% | 2 |
| 2 | Toyota Hilux | 2,800 | 3.2% | – 15.2% | 3 |
| 3 | Mazda CX-5 | 2,289 | 2.6% | + 22.3% | 8 |
| 4 | Chery Tiggo 4 | 2,234 | 2.5% | + 119.4% | 9 |
| 5 | Mitsubishi Outlander | 1,975 | 2.3% | – 5.5% | 11 |
| 6 | Ford Everest | 1,913 | 2.2% | + 13.9% | 5 |
| 7 | Hyundai Kona | 1,839 | 2.1% | + 41.4% | 12 |
| 8 | Isuzu D-Max | 1,798 | 2.0% | – 13.8% | 6 |
| 9 | GWM Haval Jolion | 1,789 | 2.0% | + 39.1% | 7 |
| 10 | Toyota RAV4 | 1,757 | 2.0% | – 65.4% | 1 |
| 11 | Toyota Corolla | 1,735 | 2.0% | + 9.6% | 15 |
| 12 | Hyundai Tucson | 1,729 | 2.0% | + 20.7% | 16 |
| 13 | Mitsubishi Triton | 1,665 | 1.9% | + 36.1% | 14 |
| 14 | Toyota Prado | 1,392 | 1.6% | – 51.1% | 21 |
| 15 | Kia Carnival | 1,321 | 1.5% | + 124.3% | 29 |
| 16 | Isuzu MU-X | 1,311 | 1.5% | + 66.8% | 18 |
| 17 | MG ZS | 1,267 | 1.4% | + 4.5% | 27 |
| 18 | Kia Sportage | 1,265 | 1.4% | – 30.7% | 20 |
| 19 | Mazda CX-3 | 1,218 | 1.4% | – 24.3% | 22 |
| 20 | BYD Sealion 7 | 1,171 | 1.3% | new | 4 |