Luxembourg August 2025: Mercedes and BMW neck on neck
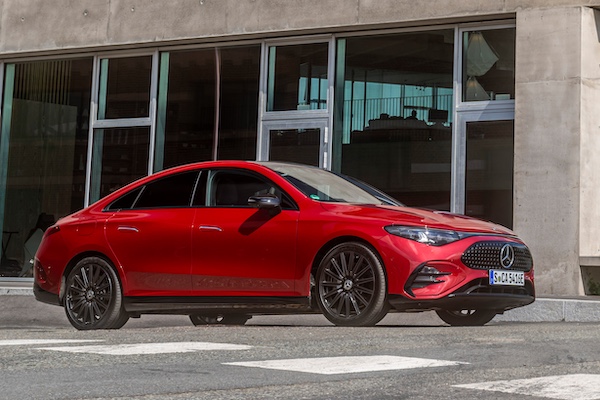 Mercedes is the #1 brand in Luxembourg in August.
2,941 new cars hit Luxembourg roads in August, a small 1.1% year-on-year lift, keeping in mind August 2024 was off -14.8% on the year prior. The year-to-date volume is now up an equally discreet 1.4% to 32,718. This month Mercedes (+0.5%) takes the brands lead for the first time in a year, toppling last month’s #1 BMW (+13.8%) for just 5 sales. Still in the YTD pole position, Volkswagen (+13.3%) drops to #3 while Skoda (+20.3%) excels in 4th place and Audi (-7.8%) struggles at #5. Renault (+92.4%), Ford (+23.2%) and Dacia (+13.6%) are all very strong in the remainder of the Top 10.
Previous month: Luxembourg July 2025: BMW repeats at #1, Dacia (+107.3%) stuns
One year ago: Luxembourg August 2024: Mercedes (+25.8%) takes the lead in weak market
Full August 2025 Top 52 All brands ranking below.
Luxembourg August 2025 – brands:
| Pos | Brand | Aug-25 | % | /24 | Jul | 2025 | % | /24 | Pos | FY24 |
| 1 | Mercedes | 368 | 12.5% | + 0.5% | 3 | 3,220 | 9.8% | + 22.4% | 3 | 3 |
| 2 | BMW | 363 | 12.3% | + 13.8% | 1 | 3,727 | 11.4% | + 0.8% | 2 | 2 |
| 3 | Volkswagen | 350 | 11.9% | + 13.3% | 2 | 3,909 | 11.9% | – 3.4% | 1 | 1 |
| 4 | Skoda | 225 | 7.7% | + 20.3% | 4 | 2,210 | 6.8% | + 11.1% | 5 | 5 |
| 5 | Audi | 213 | 7.2% | – 7.8% | 5 | 2,371 | 7.2% | + 3.6% | 4 | 4 |
| 6 | Renault | 152 | 5.2% | + 92.4% | 6 | 1,669 | 5.1% | + 18.4% | 6 | 6 |
| 7 | Kia | 96 | 3.3% | – 14.3% | 11 | 1,169 | 3.6% | + 7.4% | 8 | 10 |
| 8 | Peugeot | 91 | 3.1% | – 23.5% | 8 | 1,330 | 4.1% | + 37.5% | 7 | 7 |
| 9 | Ford | 85 | 2.9% | + 23.2% | 9 | 1,087 | 3.3% | + 35.0% | 9 | 14 |
| 10 | Dacia | 67 | 2.3% | + 13.6% | 7 | 874 | 2.7% | + 18.1% | 11 | 15 |
| 11 | Hyundai | 62 | 2.1% | – 10.1% | 14 | 891 | 2.7% | – 19.2% | 10 | 11 |
| 12 | Porsche | 62 | 2.1% | + 24.0% | 18 | 714 | 2.2% | – 21.1% | 16 | 12 |
| 13 | Toyota | 61 | 2.1% | – 44.0% | 12 | 716 | 2.2% | – 11.3% | 15 | 13 |
| 14 | Mini | 60 | 2.0% | + 0.0% | 15 | 661 | 2.0% | + 44.6% | 17 | 19 |
| 15 | Opel | 50 | 1.7% | – 16.7% | 13 | 743 | 2.3% | + 27.7% | 13 | 17 |
| 16 | Volvo | 48 | 1.6% | – 56.4% | 10 | 807 | 2.5% | – 32.3% | 12 | 9 |
| 17 | Cupra | 48 | 1.6% | – 14.3% | 19 | 623 | 1.9% | + 22.9% | 18 | 20 |
| 18 | Nissan | 48 | 1.6% | + 220.0% | 16 | 454 | 1.4% | + 36.7% | 22 | 25 |
| 19 | Citroen | 45 | 1.5% | – 6.3% | 17 | 722 | 2.2% | + 25.6% | 14 | 21 |
| 20 | Land Rover | 42 | 1.4% | – 22.2% | 20 | 459 | 1.4% | – 2.1% | 21 | 23 |
| 21 | Tesla | 37 | 1.3% | – 64.1% | 22 | 543 | 1.7% | – 53.9% | 19 | 8 |
| 22 | Mazda | 36 | 1.2% | + 100.0% | 25 | 398 | 1.2% | + 16.7% | 23 | 24 |
| 23 | Fiat | 33 | 1.1% | – 19.5% | 23 | 512 | 1.6% | – 33.3% | 20 | 16 |
| 24 | Chevrolet | 32 | 1.1% | + 3100.0% | 45 | 43 | 0.1% | + 514.3% | 41 | 53 |
| 25 | Alfa Romeo | 30 | 1.0% | + 328.6% | 26 | 216 | 0.7% | + 43.0% | 27 | 31 |
| 26 | MG | 28 | 1.0% | + 833.3% | 28 | 178 | 0.5% | – 71.7% | 29 | 22 |
| 27 | Seat | 26 | 0.9% | – 38.1% | 21 | 391 | 1.2% | – 33.6% | 24 | 18 |
| 28 | Polestar | 22 | 0.7% | + 29.4% | 32 | 197 | 0.6% | + 7.7% | 28 | 27 |
| 29 | Suzuki | 20 | 0.7% | + 122.2% | 24 | 267 | 0.8% | + 1.5% | 25 | 26 |
| 30 | Jeep | 12 | 0.4% | – 58.6% | 27 | 232 | 0.7% | + 51.6% | 26 | 28 |
| 31 | BYD | 12 | 0.4% | – 25.0% | 34 | 130 | 0.4% | – 24.0% | 30 | 30 |
| 32 | Alpine | 12 | 0.4% | + 140.0% | 29 | 85 | 0.3% | + 123.7% | 34 | 40 |
| 33 | Honda | 11 | 0.4% | – 52.2% | 30 | 99 | 0.3% | – 39.3% | 32 | 32 |
| 34 | Ferrari | 7 | 0.2% | + 40.0% | 36 | 75 | 0.2% | + 10.3% | 37 | 37 |
| 35 | Smart | 6 | 0.2% | – 50.0% | 33 | 106 | 0.3% | – 10.9% | 31 | 33 |
| 36 | Subaru | 6 | 0.2% | + 20.0% | 38 | 55 | 0.2% | – 42.1% | 39 | 36 |
| 37 | BAIC | 5 | 0.2% | – 16.7% | 43 | 37 | 0.1% | + 208.3% | 43 | 45 |
| 38 | DFSK | 4 | 0.1% | – 42.9% | 35 | 90 | 0.3% | + 200.0% | 33 | 39 |
| 39 | Lexus | 3 | 0.1% | – 72.7% | 31 | 80 | 0.2% | – 15.8% | 35 | 34 |
| 40 | Lamborghini | 3 | 0.1% | – 62.5% | 37 | 61 | 0.2% | + 10.9% | 38 | 38 |
| 41 | Xpeng | 3 | 0.1% | – 25.0% | 40 | 54 | 0.2% | + 440.0% | 40 | 44 |
| 42 | Aston Martin | 3 | 0.1% | + 50.0% | 41 | 30 | 0.1% | – 11.8% | 44 | 43 |
| 43 | Maserati | 3 | 0.1% | + 0.0% | 46 | 22 | 0.1% | – 37.1% | 46 | 41 |
| 44 | Bentley | 2 | 0.1% | n/a | 44 | 13 | 0.0% | – 40.9% | 47 | 46 |
| 45 | Dodge | 2 | 0.1% | n/a | 51 | 5 | 0.0% | n/a | 51 | 60 |
| 46 | Lancia | 1 | 0.0% | new | 42 | 38 | 0.1% | new | 42 | 49 |
| 47 | Jaguar | 1 | 0.0% | – 83.3% | 47 | 24 | 0.1% | – 78.0% | 45 | 35 |
| 48 | Lotus | 1 | 0.0% | – 66.7% | 48 | 11 | 0.0% | – 47.6% | 48 | 42 |
| 49 | Alpina | 1 | 0.0% | – 50.0% | 49 | 9 | 0.0% | + 0.0% | 49 | 52 |
| 50 | Man | 1 | 0.0% | n/a | – | 4 | 0.0% | + 100.0% | 52 | 55 |
| 51 | Caterham | 1 | 0.0% | n/a | – | 3 | 0.0% | n/a | 54 | 63 |
| 52 | SsangYong | 1 | 0.0% | + 0.0% | – | 1 | 0.0% | – 87.5% | 64 | 51 |
| – | Others | 40 | 1.4% | + 263.6% | – | 254 | 0.8% | + 161.9% | – | – |
Source: Luxembourg Statistiques