Ireland June 2025: Tesla at 22.2% share, Smart #1 up to #3
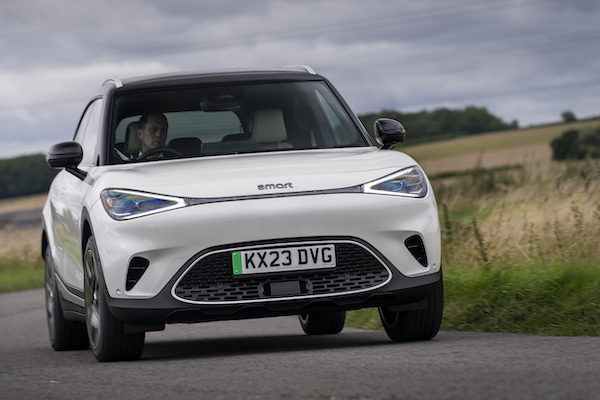 The Smart #1 is the third best-selling vehicle in Ireland in June.
Irish registrations traditionally slow down in the lead to the biannual licence plate change of July and June 2025 is up 65.5% year-on-year to a still very weak 2,441 sales. The H1 2025 tally is up 3.6% to 81,750. Tesla usually has a bumper month in June and this year is no exception: with sales up 6.1% it reaches a spectacular 22.2% share, still below the 34.3% it commanded a year ago in June 2024. Given the tiny weight of this month’s sales compared to H1, Tesla is stuck in 17th place year-to-date. Kia (+228.8%) is up to #2 but the hero of the month is Smart (+18200%) up to 7.5% share and third place vs. just 0.3% and #30 so far this year. Fiat (+6900%), Suzuki (+800%), Hyundai (+221.6%) and Ford (+139.7%) also impress with fantastic gains in the remainder of the Top 10.
Over in the models lane, like a year ago Tesla dominates with the Model 3 (+2.4%) and Model Y (+10.8%) in the lead with over 10% share each. The surprise is the arrival of the Smart #1 directly at #3 with 7.5% share vs. #107 and 0.2% share year-to-date. The new Hyundai Inster goes up a further four spots on last month to #4, distancing the Kia Sportage (+116.2%), Skoda Octavia (+65%) and VW Golf (+205%). The Suzuki Vitara (+700%), Ford Focus (+194.1%) and Jeep Avenger (+2400%) round out the Top 10 in spectacular fashion.
Previous month: Ireland May 2025: VW Tiguan #1, Hyundai Inster inside Top 10
One year ago: Ireland June 2024: Tesla up to 34.3% share, Model 3 and Y on top
Full June 2025 Top 38 All brands and Top 191 All models below.
Ireland June 2025 – brands:
| Pos | Brand | Jun-25 | % | /24 | May | 2025 | % | /24 | Pos | FY24 |
| 1 | Tesla | 542 | 22.2% | + 6.1% | 18 | 1,536 | 1.9% | – 4.1% | 17 | 14 |
| 2 | Kia | 194 | 7.9% | + 228.8% | 3 | 6,409 | 7.8% | + 14.0% | 5 | 5 |
| 3 | Smart | 183 | 7.5% | + 18200.0% | 37 | 212 | 0.3% | + 960.0% | 30 | 37 |
| 4 | Hyundai | 164 | 6.7% | + 221.6% | 2 | 7,814 | 9.6% | + 9.5% | 3 | 4 |
| 5 | Toyota | 158 | 6.5% | – 19.0% | 4 | 11,433 | 14.0% | – 2.1% | 1 | 1 |
| 6 | Volkswagen | 157 | 6.4% | + 19.8% | 1 | 9,089 | 11.1% | + 7.4% | 2 | 2 |
| 7 | Suzuki | 153 | 6.3% | + 800.0% | 14 | 1,812 | 2.2% | + 26.6% | 14 | 17 |
| 8 | Ford | 139 | 5.7% | + 139.7% | 7 | 2,963 | 3.6% | + 1.3% | 9 | 9 |
| 9 | Skoda | 120 | 4.9% | + 84.6% | 5 | 7,523 | 9.2% | – 6.9% | 4 | 3 |
| 10 | Fiat | 70 | 2.9% | + 6900.0% | 20 | 520 | 0.6% | + 34.4% | 26 | 26 |
| 11 | BYD | 69 | 2.8% | + 475.0% | 15 | 1,416 | 1.7% | + 53.7% | 18 | 19 |
| 12 | BMW | 53 | 2.2% | – 3.6% | 6 | 3,320 | 4.1% | + 9.1% | 6 | 8 |
| 13 | Jeep | 52 | 2.1% | + 2500.0% | 28 | 164 | 0.2% | + 113.0% | 31 | 32 |
| 14 | Citroen | 49 | 2.0% | + 88.5% | 22 | 692 | 0.8% | – 12.0% | 24 | 22 |
| 15 | MG | 44 | 1.8% | + 238.5% | 19 | 975 | 1.2% | + 33.6% | 22 | 23 |
| 16 | Mercedes | 36 | 1.5% | + 44.0% | 10 | 1,837 | 2.2% | – 10.8% | 13 | 13 |
| 17 | Audi | 35 | 1.4% | – 20.5% | 8 | 3,031 | 3.7% | – 13.3% | 8 | 6 |
| 18 | Dacia | 30 | 1.2% | + 3.4% | 9 | 2,483 | 3.0% | – 4.2% | 12 | 11 |
| 19 | Opel | 29 | 1.2% | + 11.5% | 17 | 1,578 | 1.9% | – 12.0% | 16 | 16 |
| 20 | Seat | 28 | 1.1% | – 3.4% | 11 | 1,651 | 2.0% | – 16.2% | 15 | 15 |
| 21 | Mini | 18 | 0.7% | – 5.3% | 27 | 469 | 0.6% | + 74.3% | 27 | 27 |
| 22 | Mazda | 17 | 0.7% | + 240.0% | 29 | 1,038 | 1.3% | + 16.2% | 21 | 21 |
| 23 | Alfa Romeo | 15 | 0.6% | n/a | 35 | 43 | 0.1% | + 16.2% | 35 | 36 |
| 24 | Nissan | 12 | 0.5% | + 50.0% | 25 | 3,203 | 3.9% | – 20.1% | 7 | 7 |
| 25 | Lexus | 12 | 0.5% | – 14.3% | 23 | 823 | 1.0% | + 37.9% | 23 | 24 |
| 26 | Porsche | 12 | 0.5% | + 33.3% | 26 | 301 | 0.4% | + 31.4% | 28 | 28 |
| 27 | Volvo | 8 | 0.3% | – 60.0% | 13 | 1,252 | 1.5% | + 5.4% | 19 | 18 |
| 28 | Land Rover | 8 | 0.3% | – 11.1% | 21 | 610 | 0.7% | – 8.0% | 25 | 25 |
| 29 | Peugeot | 6 | 0.2% | – 68.4% | 12 | 2,939 | 3.6% | + 0.7% | 11 | 10 |
| 30 | SsangYong | 6 | 0.2% | + 500.0% | 33 | 36 | 0.0% | + 20.0% | 36 | 34 |
| 31 | Renault | 5 | 0.2% | – 50.0% | 16 | 2,949 | 3.6% | + 27.9% | 10 | 12 |
| 32 | Polestar | 4 | 0.2% | – 75.0% | 31 | 63 | 0.1% | – 48.4% | 34 | 29 |
| 33 | Ineos | 4 | 0.2% | n/a | – | 4 | 0.0% | + 33.3% | 40 | 40 |
| 34 | Cupra | 3 | 0.1% | – 66.7% | 24 | 1,183 | 1.4% | + 27.2% | 20 | 20 |
| 35 | Honda | 2 | 0.1% | + 100.0% | 30 | 257 | 0.3% | + 138.0% | 29 | 30 |
| 36 | Alpine | 2 | 0.1% | n/a | 34 | 11 | 0.0% | + 266.7% | 37 | 42 |
| 37 | Xpeng | 1 | 0.0% | new | 32 | 76 | 0.1% | new | 33 | – |
| 38 | Subaru | 1 | 0.0% | n/a | – | 7 | 0.0% | – 36.4% | 38 | 38 |
Ireland June 2025 – models:
| Pos | Model | Jun-25 | % | /24 | May | 2025 | % | /24 | Pos | FY24 |
| 1 | Tesla Model 3 | 296 | 12.1% | + 2.4% | 52 | 994 | 1.2% | + 27.4% | 21 | 18 |
| 2 | Tesla Model Y | 246 | 10.1% | + 10.8% | 35 | 542 | 0.7% | – 34.0% | 45 | 26 |
| 3 | Smart #1 | 183 | 7.5% | n/a | 238 | 197 | 0.2% | + 1415.4% | 107 | 227 |
| 4 | Hyundai Inster | 100 | 4.1% | new | 8 | 400 | 0.5% | new | 62 | – |
| 5 | Kia Sportage | 80 | 3.3% | + 116.2% | 2 | 2,387 | 2.9% | – 6.9% | 4 | 3 |
| 6 | Skoda Octavia | 66 | 2.7% | + 65.0% | 6 | 2,253 | 2.8% | – 28.3% | 5 | 2 |
| 7 | VW Golf | 61 | 2.5% | + 205.0% | 7 | 1,616 | 2.0% | + 7.0% | 10 | 11 |
| 8 | Suzuki Vitara | 56 | 2.3% | + 700.0% | 65 | 457 | 0.6% | – 16.0% | 54 | 51 |
| 9 | Ford Focus | 50 | 2.0% | + 194.1% | 63 | 684 | 0.8% | – 19.9% | 31 | 28 |
| 10 | Jeep Avenger | 50 | 2.0% | + 2400.0% | 70 | 135 | 0.2% | + 200.0% | 130 | 170 |
| 11 | Fiat 500 | 47 | 1.9% | n/a | 81 | 173 | 0.2% | + 61.7% | 115 | 133 |
| 12 | BYD Atto 3 | 43 | 1.8% | + 760.0% | 130 | 234 | 0.3% | – 14.6% | 97 | 84 |
| 13 | Suzuki SX4 S-Cross | 42 | 1.7% | + 950.0% | 53 | 715 | 0.9% | + 85.2% | 30 | 70 |
| 14 | Suzuki Ignis | 38 | 1.6% | + 850.0% | 155 | 112 | 0.1% | – 52.1% | 139 | 97 |
| 15 | Toyota RAV4 | 33 | 1.4% | + 13.8% | 11 | 2,433 | 3.0% | + 5.2% | 2 | 4 |
| 16 | Kia Niro | 32 | 1.3% | + 357.1% | 38 | 648 | 0.8% | – 12.2% | 35 | 30 |
| 17 | Toyota Corolla | 32 | 1.3% | – 15.8% | 16 | 1,855 | 2.3% | – 8.6% | 6 | 7 |
| 18 | Ford Puma | 31 | 1.3% | + 14.8% | 42 | 967 | 1.2% | – 9.9% | 23 | 19 |
| 19 | Toyota Yaris Cross | 28 | 1.1% | – 51.7% | 9 | 2,400 | 2.9% | + 12.0% | 3 | 5 |
| 20 | Hyundai Tucson | 27 | 1.1% | + 12.5% | 3 | 3,340 | 4.1% | – 1.9% | 1 | 1 |
| 21 | VW Tayron | 27 | 1.1% | new | 18 | 469 | 0.6% | new | 52 | – |
| 22 | Ford Tourneo | 24 | 1.0% | n/a | 10 | 235 | 0.3% | + 1075.0% | 96 | 178 |
| 23 | Kia Stonic | 23 | 0.9% | + 2200.0% | 33 | 469 | 0.6% | + 2.2% | 51 | 44 |
| 24 | MG4 | 22 | 0.9% | + 1000.0% | 98 | 398 | 0.5% | – 16.6% | 63 | 57 |
| 25 | VW Tiguan | 22 | 0.9% | – 15.4% | 1 | 1,738 | 2.1% | + 16.2% | 8 | 6 |
| 26 | Toyota Yaris | 20 | 0.8% | + 5.3% | 34 | 1,370 | 1.7% | – 17.8% | 11 | 10 |
| 27 | BYD Seal U | 19 | 0.8% | new | 21 | 717 | 0.9% | new | 29 | 182 |
| 28 | Kia EV6 | 18 | 0.7% | + 800.0% | 43 | 632 | 0.8% | + 53.8% | 38 | 47 |
| 29 | Toyota Corolla Cross | 18 | 0.7% | – 5.3% | 28 | 1,364 | 1.7% | + 1.7% | 13 | 14 |
| 30 | VW ID.4 | 18 | 0.7% | – 30.8% | 25 | 1,172 | 1.4% | + 35.3% | 17 | 21 |
| 31 | Citroen Berlingo | 17 | 0.7% | + 6.3% | 80 | 137 | 0.2% | – 6.2% | 128 | 111 |
| 32 | Ford Kuga | 17 | 0.7% | + 41.7% | 13 | 665 | 0.8% | – 25.1% | 33 | 27 |
| 33 | Hyundai Kona | 17 | 0.7% | + 21.4% | 15 | 1,731 | 2.1% | + 5.0% | 9 | 8 |
| 34 | Toyota C-HR | 16 | 0.7% | – 11.1% | 45 | 1,369 | 1.7% | – 4.4% | 12 | 12 |
| 35 | BMW X1 | 14 | 0.6% | + 600.0% | 27 | 478 | 0.6% | + 42.7% | 49 | 68 |
| 36 | Fiat Panda | 14 | 0.6% | n/a | 54 | 253 | 0.3% | + 9.1% | 92 | 100 |
| 37 | Kia EV3 | 13 | 0.5% | new | 32 | 750 | 0.9% | new | 27 | 221 |
| 38 | Seat Ateca | 13 | 0.5% | + 160.0% | 41 | 398 | 0.5% | + 14.4% | 64 | 63 |
| 39 | Skoda Superb | 13 | 0.5% | + 225.0% | 39 | 642 | 0.8% | – 2.9% | 36 | 35 |
| 40 | Alfa Romeo Stelvio | 12 | 0.5% | n/a | – | 19 | 0.0% | + 111.1% | 216 | 239 |
| 41 | Kia Ceed | 12 | 0.5% | + 200.0% | 30 | 467 | 0.6% | – 24.1% | 53 | 36 |
| 42 | Suzuki Swift | 12 | 0.5% | + 500.0% | 44 | 504 | 0.6% | + 104.9% | 47 | 61 |
| 43 | Citroen E-C4 X | 11 | 0.5% | + 1000.0% | 176 | 53 | 0.1% | + 35.9% | 178 | 185 |
| 44 | Mini Cooper | 11 | 0.5% | + 450.0% | 75 | 315 | 0.4% | + 205.8% | 76 | 149 |
| 45 | Opel Astra | 11 | 0.5% | – 38.9% | 108 | 239 | 0.3% | – 12.5% | 95 | 89 |
| 46 | Audi A6 | 10 | 0.4% | + 900.0% | 50 | 479 | 0.6% | + 3.9% | 48 | 48 |
| 47 | BMW 5-Series | 10 | 0.4% | + 11.1% | 37 | 655 | 0.8% | + 0.5% | 34 | 37 |
| 48 | Dacia Jogger | 10 | 0.4% | + 233.3% | 105 | 297 | 0.4% | – 21.0% | 80 | 62 |
| 49 | Ford Explorer | 10 | 0.4% | new | 114 | 275 | 0.3% | new | 87 | 167 |
| 50 | MG5 | 10 | 0.4% | + 42.9% | 232 | 51 | 0.1% | – 34.6% | 181 | 136 |
| 51 | Skoda Kodiaq | 10 | 0.4% | + 100.0% | 19 | 1,807 | 2.2% | + 41.8% | 7 | 9 |
| 52 | Mazda CX-5 | 9 | 0.4% | + 350.0% | 166 | 186 | 0.2% | – 7.9% | 112 | 99 |
| 53 | Seat Ibiza | 9 | 0.4% | + 200.0% | 122 | 453 | 0.6% | + 4.9% | 55 | 55 |
| 54 | Skoda Karoq | 9 | 0.4% | + 200.0% | 24 | 908 | 1.1% | – 4.9% | 24 | 23 |
| 55 | Dacia Sandero | 8 | 0.3% | – 52.9% | 12 | 1,060 | 1.3% | – 18.7% | 19 | 13 |
| 56 | Opel Grandland X | 8 | 0.3% | n/a | 85 | 338 | 0.4% | + 56.5% | 75 | 105 |
| 57 | Skoda Enyaq | 8 | 0.3% | + 100.0% | 64 | 398 | 0.5% | – 13.9% | 65 | 65 |
| 58 | BMW 3-Series | 7 | 0.3% | + 40.0% | 83 | 198 | 0.2% | – 49.7% | 105 | 58 |
| 59 | Citroen C4 | 7 | 0.3% | + 250.0% | 125 | 182 | 0.2% | + 5.2% | 113 | 121 |
| 60 | Dacia Duster | 7 | 0.3% | – 22.2% | 22 | 988 | 1.2% | + 8.2% | 22 | 24 |
| 61 | Mercedes GLB | 7 | 0.3% | + 600.0% | 84 | 155 | 0.2% | + 72.2% | 123 | 129 |
| 62 | Porsche Macan | 7 | 0.3% | n/a | 120 | 93 | 0.1% | n/a | 149 | 208 |
| 63 | BMW IX2 | 6 | 0.2% | n/a | 129 | 31 | 0.0% | + 1450.0% | 198 | 211 |
| 64 | Hyundai i20 | 6 | 0.2% | + 200.0% | 17 | 815 | 1.0% | – 5.9% | 25 | 22 |
| 65 | Kia Sorento | 6 | 0.2% | + 20.0% | 23 | 615 | 0.8% | + 69.0% | 39 | 41 |
| 66 | Lexus NX | 6 | 0.2% | + 100.0% | 89 | 301 | 0.4% | + 24.9% | 77 | 94 |
| 67 | MG ZS | 6 | 0.2% | + 50.0% | 68 | 253 | 0.3% | + 87.4% | 93 | 125 |
| 68 | Opel Combo | 6 | 0.2% | n/a | 110 | 58 | 0.1% | + 1060.0% | 173 | 248 |
| 69 | Skoda Elroq | 6 | 0.2% | new | 56 | 197 | 0.2% | new | 106 | – |
| 70 | Ssangyong Korando | 6 | 0.2% | + 500.0% | 188 | 15 | 0.0% | – 28.6% | 230 | 202 |
| 71 | Toyota Aygo X | 6 | 0.2% | + 50.0% | 141 | 214 | 0.3% | – 30.1% | 103 | 80 |
| 72 | VW ID.3 | 6 | 0.2% | + 200.0% | 66 | 362 | 0.4% | – 21.8% | 70 | 60 |
| 73 | VW T-Roc | 6 | 0.2% | – 57.1% | 14 | 1,240 | 1.5% | + 7.9% | 15 | 15 |
| 74 | Audi Q3 | 5 | 0.2% | – 37.5% | 112 | 551 | 0.7% | – 25.0% | 44 | 29 |
| 75 | Citroen Multispace | 5 | 0.2% | n/a | 177 | 8 | 0.0% | n/a | 242 | – |
| 76 | Dacia Bigster | 5 | 0.2% | new | 69 | 65 | 0.1% | new | 169 | – |
| 77 | Hyundai Santa Fe | 5 | 0.2% | n/a | 77 | 411 | 0.5% | + 1768.2% | 60 | 112 |
| 78 | Kia EV9 | 5 | 0.2% | + 150.0% | 106 | 150 | 0.2% | – 13.3% | 125 | 103 |
| 79 | Kia Picanto | 5 | 0.2% | + 400.0% | 82 | 291 | 0.4% | – 3.0% | 85 | 72 |
| 80 | Nissan Ariya | 5 | 0.2% | n/a | 103 | 187 | 0.2% | + 23.0% | 111 | 115 |
| 81 | Suzuki Swace | 5 | 0.2% | n/a | 211 | 24 | 0.0% | + 14.3% | 207 | 189 |
| 82 | VW Taigo | 5 | 0.2% | + 400.0% | 20 | 375 | 0.5% | + 58.9% | 69 | 96 |
| 83 | Audi A3 | 4 | 0.2% | + 100.0% | 49 | 556 | 0.7% | + 6.5% | 43 | 39 |
| 84 | BMW IX1 | 4 | 0.2% | – 66.7% | 55 | 226 | 0.3% | – 21.0% | 100 | 92 |
| 85 | BMW X3 | 4 | 0.2% | – 63.6% | 26 | 381 | 0.5% | + 25.7% | 68 | 77 |
| 86 | BYD Seal | 4 | 0.2% | – 33.3% | 124 | 293 | 0.4% | – 37.1% | 82 | 49 |
| 87 | Citroen C5 X | 4 | 0.2% | + 33.3% | 164 | 33 | 0.0% | – 32.7% | 194 | 179 |
| 88 | Fiat Tipo | 4 | 0.2% | n/a | 223 | 17 | 0.0% | + 325.0% | 220 | 242 |
| 89 | Hyundai Ioniq 5 | 4 | 0.2% | + 0.0% | 29 | 280 | 0.3% | – 9.1% | 86 | 73 |
| 90 | Ineos Grenadier | 4 | 0.2% | n/a | – | 4 | 0.0% | + 33.3% | 262 | 261 |
| 91 | Land Rover Defender | 4 | 0.2% | + 100.0% | 115 | 87 | 0.1% | – 15.5% | 155 | 138 |
| 92 | Mercedes EQS SUV | 4 | 0.2% | n/a | 139 | 39 | 0.0% | + 200.0% | 187 | 216 |
| 93 | Mercedes EQV | 4 | 0.2% | n/a | – | 4 | 0.0% | + 100.0% | 263 | 254 |
| 94 | MG HS | 4 | 0.2% | n/a | 87 | 146 | 0.2% | + 329.4% | 126 | 199 |
| 95 | Seat Leon | 4 | 0.2% | – 66.7% | 47 | 190 | 0.2% | + 55.7% | 109 | 119 |
| 96 | Skoda Fabia | 4 | 0.2% | – 20.0% | 61 | 558 | 0.7% | – 1.4% | 42 | 42 |
| 97 | VW ID.7 | 4 | 0.2% | + 100.0% | 132 | 230 | 0.3% | + 94.9% | 98 | 104 |
| 98 | Alfa Romeo Junior | 3 | 0.1% | new | 214 | 10 | 0.0% | new | 238 | – |
| 99 | Audi A1 | 3 | 0.1% | n/a | 127 | 113 | 0.1% | – 3.4% | 138 | 128 |
| 100 | Audi Q4 | 3 | 0.1% | – 57.1% | 79 | 135 | 0.2% | – 59.5% | 129 | 74 |
| 101 | Audi Q7 | 3 | 0.1% | n/a | 74 | 160 | 0.2% | + 370.6% | 119 | 151 |
| 102 | BMW i4 | 3 | 0.1% | + 200.0% | 135 | 102 | 0.1% | – 25.5% | 152 | 123 |
| 103 | BMW X5 | 3 | 0.1% | + 0.0% | 58 | 667 | 0.8% | + 120.9% | 32 | 59 |
| 104 | Fiat 500X | 3 | 0.1% | n/a | – | 7 | 0.0% | – 80.0% | 246 | 197 |
| 105 | Hyundai i10 | 3 | 0.1% | – 50.0% | 5 | 347 | 0.4% | + 23.5% | 72 | 67 |
| 106 | Mazda CX-60 | 3 | 0.1% | + 200.0% | 198 | 90 | 0.1% | – 21.1% | 151 | 130 |
| 107 | Mercedes C Class | 3 | 0.1% | + 200.0% | 94 | 166 | 0.2% | + 163.5% | 118 | 152 |
| 108 | Mercedes E Class | 3 | 0.1% | + 0.0% | 96 | 351 | 0.4% | – 2.2% | 71 | 66 |
| 109 | Mercedes GLC | 3 | 0.1% | + 0.0% | 97 | 293 | 0.4% | + 5.0% | 83 | 88 |
| 110 | Mini Countryman | 3 | 0.1% | – 66.7% | 158 | 77 | 0.1% | + 24.2% | 159 | 144 |
| 111 | Nissan Juke | 3 | 0.1% | – 25.0% | 159 | 1,112 | 1.4% | – 32.2% | 18 | 17 |
| 112 | Nissan X-Trail | 3 | 0.1% | n/a | 184 | 346 | 0.4% | + 2.7% | 73 | 75 |
| 113 | Peugeot 3008 | 3 | 0.1% | – 57.1% | 46 | 1,173 | 1.4% | + 47.9% | 16 | 25 |
| 114 | Porsche Cayenne | 3 | 0.1% | + 0.0% | 109 | 115 | 0.1% | – 15.4% | 137 | 126 |
| 115 | Skoda Kamiq | 3 | 0.1% | + 0.0% | 48 | 470 | 0.6% | – 30.7% | 50 | 32 |
| 116 | Toyota bZ4X | 3 | 0.1% | – 70.0% | 116 | 298 | 0.4% | + 35.5% | 79 | 87 |
| 117 | VW Polo | 3 | 0.1% | – 81.3% | 4 | 1,045 | 1.3% | – 0.3% | 20 | 20 |
| 118 | Alpine A110 | 2 | 0.1% | n/a | 156 | 11 | 0.0% | + 266.7% | 236 | 269 |
| 119 | Audi Q5 | 2 | 0.1% | – 86.7% | 57 | 256 | 0.3% | + 10.3% | 91 | 79 |
| 120 | BYD Sealion | 2 | 0.1% | new | 104 | 95 | 0.1% | new | 145 | – |
| 121 | Cupra Born | 2 | 0.1% | + 0.0% | 102 | 178 | 0.2% | – 14.4% | 114 | 106 |
| 122 | Fiat 600 | 2 | 0.1% | + 100.0% | 165 | 67 | 0.1% | + 2133.3% | 167 | 186 |
| 123 | Ford Transit Custom | 2 | 0.1% | n/a | 224 | 17 | 0.0% | + 466.7% | 221 | 253 |
| 124 | Hyundai Bayon | 2 | 0.1% | + 100.0% | 137 | 214 | 0.3% | – 25.4% | 102 | 81 |
| 125 | Jeep Renegade | 2 | 0.1% | n/a | – | 17 | 0.0% | + 6.3% | 223 | 226 |
| 126 | Lexus ES | 2 | 0.1% | + 100.0% | 153 | 87 | 0.1% | – 2.2% | 156 | 140 |
| 127 | Lexus LBX | 2 | 0.1% | – 71.4% | 71 | 270 | 0.3% | + 121.3% | 94 | 98 |
| 128 | Mazda CX-80 | 2 | 0.1% | new | 181 | 69 | 0.1% | new | 165 | 234 |
| 129 | Mazda MX-30 | 2 | 0.1% | n/a | 167 | 41 | 0.1% | + 272.7% | 185 | 204 |
| 130 | Mercedes A Class | 2 | 0.1% | n/a | 126 | 116 | 0.1% | + 510.5% | 135 | 207 |
| 131 | Mercedes CLA | 2 | 0.1% | – 50.0% | 95 | 188 | 0.2% | – 23.9% | 110 | 90 |
| 132 | Mercedes EQE SUV | 2 | 0.1% | + 100.0% | 72 | 98 | 0.1% | + 30.7% | 144 | 148 |
| 133 | Mercedes EQS | 2 | 0.1% | n/a | 168 | 13 | 0.0% | + 62.5% | 235 | 230 |
| 134 | Mercedes GLE | 2 | 0.1% | – 33.3% | 107 | 95 | 0.1% | – 41.0% | 146 | 117 |
| 135 | MG3 | 2 | 0.1% | n/a | 157 | 119 | 0.1% | + 1883.3% | 133 | 161 |
| 136 | Mini Clubman | 2 | 0.1% | + 0.0% | 233 | 30 | 0.0% | – 28.6% | 200 | 160 |
| 137 | Opel Corsa | 2 | 0.1% | + 0.0% | 185 | 445 | 0.5% | – 23.9% | 56 | 45 |
| 138 | Opel Mokka | 2 | 0.1% | – 60.0% | 40 | 423 | 0.5% | – 15.6% | 59 | 50 |
| 139 | Peugeot 2008 | 2 | 0.1% | – 60.0% | 76 | 438 | 0.5% | – 37.8% | 57 | 33 |
| 140 | Polestar 2 | 2 | 0.1% | – 87.5% | – | 37 | 0.0% | – 69.7% | 189 | 114 |
| 141 | Porsche Panamera | 2 | 0.1% | + 100.0% | 149 | 51 | 0.1% | + 218.8% | 182 | 177 |
| 142 | Range Rover Evoque | 2 | 0.1% | – 50.0% | 150 | 58 | 0.1% | + 3.6% | 174 | 168 |
| 143 | Renault 5 | 2 | 0.1% | new | 121 | 94 | 0.1% | new | 147 | – |
| 144 | Seat Arona | 2 | 0.1% | – 75.0% | 31 | 585 | 0.7% | – 8.9% | 41 | 34 |
| 145 | Volvo C40 | 2 | 0.1% | n/a | 212 | 40 | 0.0% | – 37.5% | 186 | 155 |
| 146 | Volvo EX30 | 2 | 0.1% | – 50.0% | 100 | 292 | 0.4% | + 54.5% | 84 | 95 |
| 147 | Volvo XC90 | 2 | 0.1% | – 71.4% | 86 | 270 | 0.3% | – 10.9% | 88 | 83 |
| 148 | VW ID.Buzz | 2 | 0.1% | n/a | 173 | 20 | 0.0% | – 9.1% | 215 | 153 |
| 149 | Audi A5 | 1 | 0.0% | – 50.0% | 62 | 426 | 0.5% | + 108.8% | 58 | 113 |
| 150 | Audi A8 | 1 | 0.0% | n/a | 215 | 8 | 0.0% | – 20.0% | 241 | 233 |
| 151 | Audi Q2 | 1 | 0.0% | + 0.0% | 117 | 142 | 0.2% | – 15.0% | 127 | 116 |
| 152 | Audi Q6 e-tron | 1 | 0.0% | new | 123 | 103 | 0.1% | new | 141 | 214 |
| 153 | Audi Q8 | 1 | 0.0% | + 0.0% | 128 | 78 | 0.1% | + 151.6% | 157 | 173 |
| 154 | BMW i5 | 1 | 0.0% | n/a | 118 | 51 | 0.1% | + 30.8% | 179 | 181 |
| 155 | BMW iX | 1 | 0.0% | n/a | 162 | 15 | 0.0% | – 62.5% | 227 | 206 |
| 156 | BYD Dolphin | 1 | 0.0% | + 0.0% | 136 | 77 | 0.1% | – 57.5% | 158 | 101 |
| 156 | Citroen Ami | 1 | 0.0% | new | – | 20 | 0.0% | new | 213 | 251 |
| 157 | Citroen C3 | 1 | 0.0% | + 0.0% | 219 | 5 | 0.0% | – 94.4% | 252 | 145 |
| 158 | Citroen C3 Aircross | 1 | 0.0% | + 0.0% | – | 3 | 0.0% | – 95.0% | 267 | 164 |
| 159 | Citroen C4 X | 1 | 0.0% | n/a | – | 21 | 0.0% | + 61.5% | 211 | 198 |
| 160 | Citroen C5 Aircross | 1 | 0.0% | – 50.0% | 113 | 223 | 0.3% | + 21.9% | 101 | 110 |
| 161 | Cupra Terramar | 1 | 0.0% | new | 131 | 167 | 0.2% | new | 117 | – |
| 162 | Ford Capri | 1 | 0.0% | new | 144 | 66 | 0.1% | new | 168 | – |
| 163 | Ford Mustang Mach-E | 1 | 0.0% | n/a | – | 13 | 0.0% | – 7.1% | 234 | 222 |
| 164 | Honda CR-V | 1 | 0.0% | n/a | 194 | 26 | 0.0% | + 0.0% | 205 | 188 |
| 165 | Honda E | 1 | 0.0% | n/a | – | 1 | 0.0% | – 92.9% | 287 | 276 |
| 166 | Lexus RX | 1 | 0.0% | + 0.0% | 146 | 89 | 0.1% | – 16.0% | 153 | 141 |
| 167 | Lexus RZ | 1 | 0.0% | new | – | 15 | 0.0% | new | 228 | – |
| 168 | Mazda MX-5 | 1 | 0.0% | n/a | 199 | 27 | 0.0% | + 50.0% | 204 | 201 |
| 169 | Mercedes EQE | 1 | 0.0% | + 0.0% | 182 | 31 | 0.0% | – 77.0% | 199 | 134 |
| 170 | Mercedes Maybach | 1 | 0.0% | n/a | – | 2 | 0.0% | n/a | 275 | – |
| 171 | Mini Aceman | 1 | 0.0% | new | 205 | 33 | 0.0% | new | 195 | – |
| 172 | Mini Convertible | 1 | 0.0% | n/a | 169 | 14 | 0.0% | – 74.5% | 231 | 180 |
| 173 | Nissan Qashqai | 1 | 0.0% | n/a | 90 | 1,257 | 1.5% | – 23.4% | 14 | 16 |
| 174 | Peugeot 5008 | 1 | 0.0% | n/a | 51 | 738 | 0.9% | + 20.2% | 28 | 40 |
| 175 | Polestar 3 | 1 | 0.0% | new | 236 | 4 | 0.0% | new | 258 | 212 |
| 176 | Polestar 4 | 1 | 0.0% | new | 140 | 22 | 0.0% | new | 209 | 196 |
| 177 | Range Rover | 1 | 0.0% | – 50.0% | 154 | 117 | 0.1% | + 37.6% | 134 | 139 |
| 178 | Range Rover Sport | 1 | 0.0% | n/a | 60 | 259 | 0.3% | – 18.3% | 90 | 82 |
| 179 | Renault Captur | 1 | 0.0% | – 50.0% | 59 | 793 | 1.0% | + 72.4% | 26 | 43 |
| 180 | Renault Rafale | 1 | 0.0% | new | 160 | 62 | 0.1% | new | 171 | 184 |
| 181 | Renault Scenic | 1 | 0.0% | n/a | 151 | 160 | 0.2% | + 3900.0% | 120 | 174 |
| 182 | Skoda Scala | 1 | 0.0% | + 0.0% | 171 | 297 | 0.4% | – 13.9% | 81 | 71 |
| 183 | Subaru Solterra | 1 | 0.0% | n/a | – | 4 | 0.0% | – 42.9% | 260 | 237 |
| 184 | Toyota GT86 | 1 | 0.0% | n/a | – | 1 | 0.0% | n/a | 288 | – |
| 185 | Toyota Proace | 1 | 0.0% | n/a | – | 14 | 0.0% | n/a | 232 | 278 |
| 186 | Volvo EX40 | 1 | 0.0% | new | 142 | 92 | 0.1% | new | 150 | – |
| 187 | Volvo XC60 | 1 | 0.0% | – 83.3% | 36 | 408 | 0.5% | – 2.9% | 61 | 52 |
| 188 | VW ID.5 | 1 | 0.0% | + 0.0% | 161 | 75 | 0.1% | + 2.7% | 161 | 150 |
| 189 | VW T-Cross | 1 | 0.0% | – 90.9% | 101 | 636 | 0.8% | + 17.8% | 37 | 38 |
| 190 | VW T7 | 1 | 0.0% | n/a | 133 | 61 | 0.1% | + 125.9% | 172 | 195 |
| 191 | Xpeng G6 | 1 | 0.0% | new | 143 | 76 | 0.1% | new | 160 | – |
Source: SIMI