Australia June 2025: BYD up to #5, China-built at 23% share
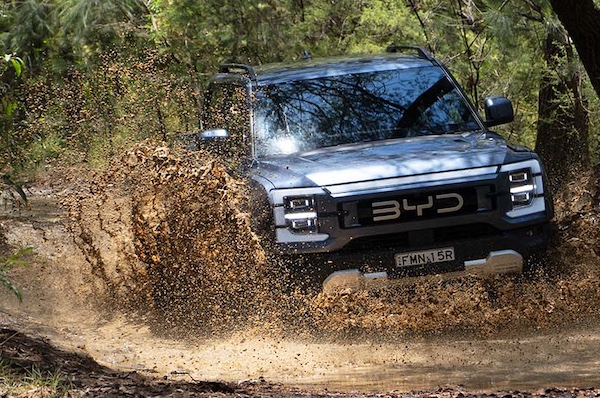 The BYD Shark 6 is up to a record 5th place in June.
New car sales in Australia register their 2nd year-on-year gain in June at +6.2% to 127,437 units. This is the best June result in 7 years: since the 130,300 units of June 2018. The H1 2025 volume stands at 624,130 (-1.4%), the second highest mark halfway through the year below just last year (632,412). SUV sales surge 15.1% to 75,072 and 58.9% share vs. 54.5% in June 2024 and 55.3% two years ago, light commercials gain 11.3% to 31,021 and 24.3% share vs. 23.2% last year and 23.1% in 2023 but passenger cars sink -21.9% to 16,457 and 12.9% share vs. 17.6% in 2024 and 16.3% two years ago. As you’ll see below there is not a single passenger car in the Top 20 this month. Heavy commercials drop -10.6% to 4,887 and 3.9% share vs. 4.6% last year. The four main states and territories are in positive: New South Wales is up 1.8% to 36,887, Victoria up 1.2% to 32,747, Queensland up 5.1% to 27,592 and Western Australia up 6.8% to 12,895. In contrast South Australia edges down -0.9% to 7,862, Tasmania is down -4% to 1,822, Australian Capital Territory off -9.1% and Northern Territory down -1.1% to 1,017.
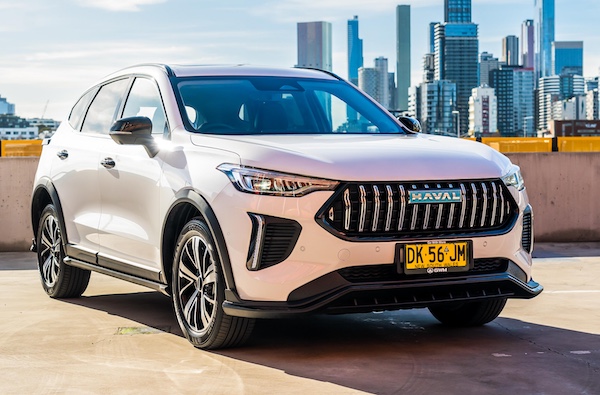 GWM breaks its Australian monthly volume record in June…
Private sales reduce their footprint as they trail the market at +3.7% to 62,958, business fleet do the same at +3.3% to 45,885 but rentals shoot up 14.5% to 5,883. Government fleets drop -26.1% to 2,896. BEV sales gain 37.6% to 13,169 and 10.3% share vs. 8% a year ago but remain down -6.1% YTD to 47,145. PHEVs surge 219.1% to 6,220 and 4.9% vs. 1.6% last year (25,613 YTD), mainly due to the success of one model as we’ll see further down. Meanwhile petrol sales are down -3% to 48,867 (249,499 YTD), diesel is up 5.5% to 38,939 (185,481 YTD) and HEVs edge up 0.1% to 15,355 (93,746 YTD). Looking at sales by origin, Japan is down -10.3% to 31,055, China soars 60.5% to 29,933 displacing Thailand (+5% to 27,802) as #2 for the first time, South Korea loses -3.1% to 15,095 and Germany is down -11.1% to 5,698.
 …as does Chery.
Over in the brands charts, Toyota (-3.2%) underperforms and falls to a very weak 15.9% share vs. 19.4% over the First Half of the year. Ford (+6.4%) evolves like the market to 7.9% share, with Mazda (-0.8%) stable at #3. Hyundai (+28.3%) overtakes sister brand Kia (-5%) for the first time since last October. The event of the month is the 5th place of BYD, up a surreal 367.9% year-on-year with a record 8,156 sales and 6.4% share. Its previous best was #7 with 4,811 sales and 4.3% share last March. This is only the 2nd time a Chinese brand manages to rank within the five most popular brands in Australia after MG did so in December 2022 (#5). BYD also hits the highest monthly volume and share ever for a Chinese manufacturer, previous best being MG at 6,102 in October 2023 and 5.9% in December 2022.
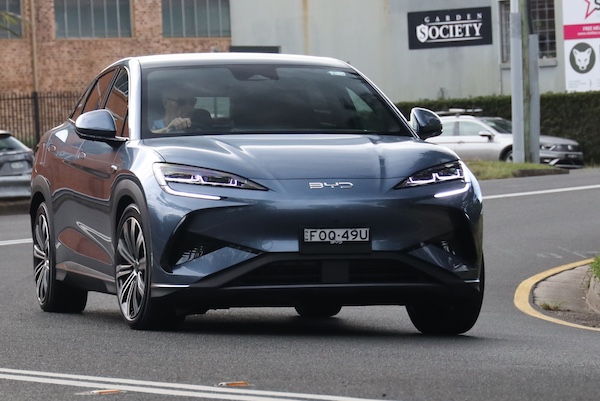 The BYD Sealion 7 is the 2nd best-selling SUV in the country in June below the Tesla Model Y.
But the Chinese offensive doesn’t stop with BYD: GWM at #7 (+30.9%) and Chery at #14 (+180.3%) both break their monthly volume record as well. Recent launch Geely is up two spots on last month to a record #24 with still small 0.6% share and only one model. Omoda Jaecoo drops to #32, JAC stays at #39, Zeekr advances to #40, Leapmotor repeats at #44 and Deepal falls four ranks to #46, the latter few with still minuscule volumes. In other news, Mitsubishi (-30.9%) freefalls to #8 while Isuzu (+15.9%) resists and Subaru (+3.4%) returns to the Top 10 for the first time since last February. Tesla is down -2% to #11.
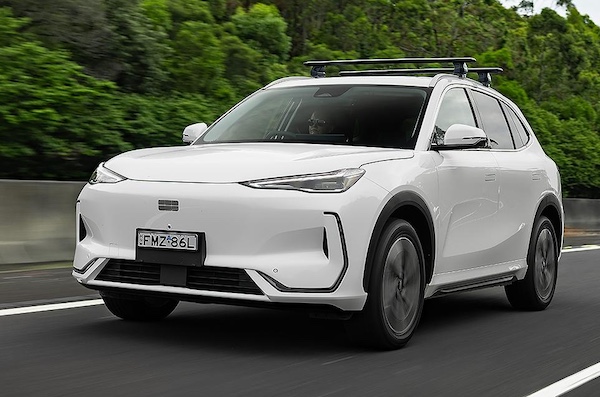 Launched in March, the Geely EX5 is already inside the Top 50 in June.
Model-wise, the Ford Ranger (+0.1%) reclaims the top spot it holds year-to-date but its advance over the much older Toyota Hilux (+10%) is only 98 sales. The Ranger’s advantage in the most lucrative 4×4 pickup segment is more glaring at 5,952 vs. 5,275. The HIlux ascends to #2 year-to-date also, overtaking the Toyota RAV4 (-38%) down to a pale #9 spot for the month, the nameplate’s lowest since March 2023. The Tesla Model Y (+19%) is up one rank on May to #3, its first podium appearance since March 2024. It is the best-selling SUV in the country by a large margin above the Ford Everest (#6) and Mazda CX-5 (#7). The BYD Shark 6 makes a splash: it soars 19 ranks on last month to a record 5th place. Another record breaker is the Hyundai Kona (+37.7%) up to #8, as the nameplate has been slowly creeping up the ranking over the years as its controversial design grew more accepted. BYD also places the Sealion 7 at #17 and the Sealion 6 at #19.
Note: A complete models ranking will be uploaded to this article when made available to us.
Previous month: Australia May 2025: Tesla Model Y and Chery Tiggo 4 shine in market of -1.6%
One year ago: Australia June 2024: First market drop in 20 months, Mitsubishi (+48.9%) places Outlander at #4
Full June 2025 Top 55 All brands and Top 50 models below.
Australia June 2025 – brands:
| Pos | Brand | Jun-25 | % | /24 | May | 2025 | % | /24 | Pos | FY24 |
| 1 | Toyota | 20,225 | 15.9% | – 3.2% | 1 | 120,978 | 19.4% | – 0.3% | 1 | 1 |
| 2 | Ford | 10,103 | 7.9% | + 6.4% | 2 | 47,300 | 7.6% | – 4.7% | 3 | 2 |
| 3 | Mazda | 9,405 | 7.4% | – 0.8% | 3 | 48,942 | 7.8% | + 0.8% | 2 | 3 |
| 4 | Hyundai | 8,407 | 6.6% | + 28.3% | 5 | 38,948 | 6.2% | + 7.9% | 5 | 6 |
| 5 | BYD | 8,156 | 6.4% | + 367.9% | 12 | 23,355 | 3.7% | + 144.6% | 8 | 17 |
| 6 | Kia | 7,810 | 6.1% | – 5.0% | 4 | 40,750 | 6.5% | – 1.3% | 4 | 4 |
| 7 | GWM | 5,464 | 4.3% | + 30.9% | 8 | 25,189 | 4.0% | + 17.0% | 7 | 10 |
| 8 | Mitsubishi | 5,336 | 4.2% | – 30.9% | 6 | 33,379 | 5.3% | – 15.8% | 6 | 5 |
| 9 | Isuzu Ute | 5,152 | 4.0% | + 15.9% | 7 | 21,883 | 3.5% | – 15.5% | 9 | 8 |
| 10 | Subaru | 4,610 | 3.6% | + 3.4% | 11 | 19,910 | 3.2% | – 8.4% | 12 | 11 |
| 11 | Tesla | 4,589 | 3.6% | – 2.0% | 9 | 14,146 | 2.3% | – 38.8% | 14 | 12 |
| 12 | MG | 3,896 | 3.1% | – 7.8% | 10 | 21,674 | 3.5% | – 11.9% | 10 | 7 |
| 13 | Nissan | 3,468 | 2.7% | – 19.2% | 14 | 20,604 | 3.3% | – 17.3% | 11 | 9 |
| 14 | Chery | 3,024 | 2.4% | + 180.3% | 15 | 14,123 | 2.3% | + 228.8% | 15 | 22 |
| 15 | Mercedes | 3,020 | 2.4% | + 25.2% | 17 | 13,706 | 2.2% | + 14.6% | 17 | 15 |
| 16 | Volkswagen | 2,954 | 2.3% | – 21.4% | 16 | 14,776 | 2.4% | – 21.7% | 13 | 13 |
| 17 | BMW | 2,641 | 2.1% | – 16.1% | 13 | 13,712 | 2.2% | + 0.5% | 16 | 14 |
| 18 | Audi | 1,622 | 1.3% | – 2.8% | 21 | 6,839 | 1.1% | – 16.4% | 22 | 19 |
| 19 | LDV | 1,581 | 1.2% | – 4.6% | 22 | 7,340 | 1.2% | – 16.6% | 20 | 18 |
| 20 | Suzuki | 1,539 | 1.2% | – 13.1% | 19 | 8,528 | 1.4% | – 18.7% | 18 | 16 |
| 21 | Honda | 1,511 | 1.2% | + 0.9% | 20 | 8,068 | 1.3% | – 7.3% | 19 | 20 |
| 22 | Lexus | 1,423 | 1.1% | + 17.7% | 18 | 7,338 | 1.2% | + 16.7% | 21 | 21 |
| 23 | Land Rover | 888 | 0.7% | – 10.8% | 23 | 4,391 | 0.7% | + 9.3% | 23 | 24 |
| 24 | Geely | 822 | 0.6% | new | 26 | 1,845 | 0.3% | new | 31 | – |
| 25 | Volvo | 706 | 0.6% | – 34.8% | 24 | 3,597 | 0.6% | – 24.1% | 24 | 23 |
| 26 | Mini | 539 | 0.4% | + 77.3% | 27 | 2,843 | 0.5% | + 80.4% | 26 | 30 |
| 27 | Renault | 537 | 0.4% | – 17.4% | 29 | 2,450 | 0.4% | – 17.5% | 27 | 26 |
| 28 | Porsche | 514 | 0.4% | – 24.7% | 25 | 2,965 | 0.5% | – 12.8% | 25 | 25 |
| 29 | KGM Ssangyong | 505 | 0.4% | – 32.3% | 28 | 2,280 | 0.4% | – 28.7% | 28 | 27 |
| 30 | Chevrolet | 420 | 0.3% | + 9.7% | 33 | 1,936 | 0.3% | – 4.1% | 30 | 29 |
| 31 | Skoda | 406 | 0.3% | – 9.0% | 30 | 2,154 | 0.3% | – 26.9% | 29 | 28 |
| 32 | Omoda Jaecoo | 380 | 0.3% | new | 31 | 690 | 0.1% | new | 40 | – |
| 33 | Cupra | 361 | 0.3% | + 139.1% | 35 | 1,614 | 0.3% | + 40.3% | 33 | 33 |
| 34 | Polestar | 339 | 0.3% | – 4.8% | 34 | 1,173 | 0.2% | + 23.5% | 34 | 36 |
| 35 | Ram | 331 | 0.3% | – 18.7% | 32 | 1,663 | 0.3% | – 18.6% | 32 | 31 |
| 36 | Genesis | 167 | 0.1% | + 23.7% | 38 | 765 | 0.1% | + 7.7% | 38 | 37 |
| 37 | Jeep | 159 | 0.1% | – 8.6% | 36 | 1,072 | 0.2% | – 16.4% | 35 | 32 |
| 38 | Peugeot | 155 | 0.1% | – 39.2% | 40 | 729 | 0.1% | – 38.7% | 39 | 35 |
| 39 | JAC | 118 | 0.1% | new | 39 | 907 | 0.1% | new | 37 | – |
| 40 | Zeekr | 111 | 0.1% | new | 41 | 450 | 0.1% | new | 41 | – |
| 41 | Jaguar | 98 | 0.1% | + 7.7% | 43 | 357 | 0.1% | – 11.4% | 42 | 38 |
| 42 | Fiat | 86 | 0.1% | – 42.3% | 37 | 915 | 0.1% | + 11.2% | 36 | 34 |
| 43 | Alfa Romeo | 64 | 0.1% | + 0.0% | 45 | 282 | 0.0% | – 24.0% | 44 | 39 |
| 44 | Leapmotor | 60 | 0.0% | new | 44 | 309 | 0.0% | new | 43 | 48 |
| 45 | GMC | 41 | 0.0% | new | 46 | 70 | 0.0% | new | 50 | – |
| 46 | Deepal | 32 | 0.0% | new | 42 | 99 | 0.0% | new | 49 | – |
| 47 | Maserati | 30 | 0.0% | – 23.1% | 48 | 151 | 0.0% | – 24.5% | 45 | 40 |
| 48 | Lamborghini | 26 | 0.0% | – 25.7% | 47 | 150 | 0.0% | + 15.4% | 46 | 41 |
| 49 | Aston Martin | 22 | 0.0% | – 8.3% | 50 | 106 | 0.0% | + 23.3% | 47 | 45 |
| 50 | Ferrari | 13 | 0.0% | – 53.6% | 49 | 100 | 0.0% | – 11.5% | 48 | 42 |
| 51 | Lotus | 9 | 0.0% | – 50.0% | 52 | 38 | 0.0% | – 62.7% | 53 | 44 |
| 52 | Bentley | 8 | 0.0% | – 66.7% | 51 | 59 | 0.0% | – 42.2% | 51 | 43 |
| 53 | McLaren | 5 | 0.0% | – 64.3% | 53 | 39 | 0.0% | – 4.9% | 52 | 47 |
| 54 | Rolls-Royce | 2 | 0.0% | – 66.7% | 54 | 37 | 0.0% | + 42.3% | 54 | 49 |
| 55 | Citroen | 1 | 0.0% | – 95.2% | 55 | 7 | 0.0% | – 90.5% | 55 | 46 |
Australia June 2025 – models:
| Pos | Model | Jun-25 | % | /24 | May | 2025 | % | /24 | Pos | FY24 |
| 1 | Ford Ranger | 6,293 | 4.9% | + 0.1% | 2 | 28,311 | 4.5% | – 15.6% | 1 | 1 |
| 2 | Toyota Hilux | 6,195 | 4.9% | + 10.0% | 1 | 26,267 | 4.2% | – 7.9% | 2 | 3 |
| 3 | Tesla Model Y | 3,457 | 2.7% | + 19.0% | 4 | 10,431 | 1.7% | – 16.7% | 11 | 11 |
| 4 | Isuzu D-Max | 3,119 | 2.4% | + 8.3% | 6 | 14,065 | 2.3% | – 11.1% | 5 | 4 |
| 5 | BYD Shark 6 | 2,993 | 2.3% | new | 24 | 10,424 | 1.7% | new | 12 | – |
| 6 | Ford Everest | 2,705 | 2.1% | + 19.3% | 7 | 12,294 | 2.0% | + 9.0% | 6 | 6 |
| 7 | Mazda CX-5 | 2,582 | 2.0% | – 3.9% | 8 | 11,991 | 1.9% | + 0.6% | 7 | 8 |
| 8 | Hyundai Kona | 2,484 | 1.9% | + 37.7% | 10 | 11,241 | 1.8% | + 25.6% | 9 | 17 |
| 9 | Toyota RAV4 | 2,421 | 1.9% | – 38.0% | 3 | 24,034 | 3.9% | – 5.4% | 3 | 2 |
| 10 | Hyundai Tucson | 2,332 | 1.8% | + 29.9% | 11 | 10,272 | 1.6% | + 8.6% | 13 | 12 |
| 11 | Toyota Prado | 2,177 | 1.7% | + 8273.1% | 5 | 15,583 | 2.5% | + 345.5% | 4 | 37 |
| 12 | Mitsubishi Triton | 2,034 | 1.6% | + 14.1% | 16 | 9,228 | 1.5% | – 1.3% | 16 | 14 |
| 13 | Isuzu MU-X | 2,033 | 1.6% | + 30.0% | 14 | 7,818 | 1.3% | – 22.5% | 22 | 15 |
| 14 | GWM Haval Jolion | 2,000 | 1.6% | + 53.3% | 17 | 9,029 | 1.4% | + 26.6% | 17 | 24 |
| 15 | MG ZS | 1,945 | 1.5% | – 1.3% | 13 | 10,177 | 1.6% | – 13.8% | 14 | 9 |
| 16 | Kia Sportage | 1,835 | 1.4% | – 1.1% | 18 | 10,558 | 1.7% | + 0.8% | 10 | 10 |
| 17 | BYD Sealion 7 | 1,795 | 1.4% | new | 61 | 3,756 | 0.6% | new | 48 | – |
| 18 | Chery Tiggo 4 | 1,768 | 1.4% | new | 12 | 7,996 | 1.3% | new | 20 | 117 |
| 19 | BYD Sealion 6 | 1,604 | 1.3% | + 232.8% | 68 | 4,375 | 0.7% | + 807.7% | 42 | 56 |
| 20 | Mazda CX-3 | 1,577 | 1.2% | – 1.3% | 25 | 8,221 | 1.3% | – 3.7% | 19 | 13 |
| 21 | Subaru Crosstrek | 1,550 | 1.2% | + 19.8% | 37 | 6,002 | 1.0% | – 0.1% | 28 | 31 |
| 22 | Mazda BT-50 | 1,501 | 1.2% | + 1.8% | 23 | 7,844 | 1.3% | – 1.2% | 21 | 22 |
| 23 | Toyota Corolla | 1,452 | 1.1% | – 34.9% | 15 | 9,359 | 1.5% | – 29.0% | 15 | 7 |
| 24 | Subaru Forester | 1,426 | 1.1% | + 8.9% | 28 | 6,495 | 1.0% | – 5.2% | 26 | 25 |
| 25 | Nissan X-Trail | 1,344 | 1.1% | – 6.5% | 29 | 8,553 | 1.4% | – 9.5% | 18 | 16 |
| 26 | Mazda CX-30 | 1,297 | 1.0% | – 0.7% | 32 | 6,202 | 1.0% | + 0.5% | 27 | 27 |
| 27 | GWM Haval H6/GT | 1,278 | 1.0% | + 39.5% | 26 | 6,909 | 1.1% | + 46.3% | 24 | 41 |
| 28 | Hyundai i30 | 1,256 | 1.0% | + 54.7% | 36 | 5,579 | 0.9% | – 14.4% | 32 | 26 |
| 29 | Mitsubishi Outlander | 1,196 | 0.9% | – 60.7% | 20 | 11,399 | 1.8% | – 21.1% | 8 | 5 |
| 30 | Mitsubishi ASX | 1,159 | 0.9% | + 0.6% | 30 | 6,656 | 1.1% | + 9.5% | 25 | 29 |
| 31 | Toyota Land Cruiser Wagon | 1,142 | 0.9% | – 11.3% | 9 | 5,108 | 0.8% | – 44.1% | 37 | 21 |
| 32 | Tesla Model 3 | 1,132 | 0.9% | – 36.3% | 85 | 3,715 | 0.6% | – 65.0% | 49 | 18 |
| 33 | Subaru Outback | 1,125 | 0.9% | – 12.5% | 41 | 4,771 | 0.8% | – 17.5% | 38 | 33 |
| 34 | Toyota Kluger | 1,122 | 0.9% | + 20.3% | 21 | 4,611 | 0.7% | + 10.9% | 39 | 36 |
| 35 | Toyota Land Cruiser PU/CC | 1,101 | 0.9% | – 5.8% | 31 | 5,266 | 0.8% | – 15.1% | 34 | 30 |
| 36 | Mazda3 | 1,064 | 0.8% | + 7.3% | 40 | 5,599 | 0.9% | + 2.1% | 31 | 32 |
| 37 | GWM Cannon | 980 | 0.8% | new | 48 | 2,712 | 0.4% | new | 52 | 343 |
| 38 | Kia Carnival | 973 | 0.8% | – 24.7% | 33 | 5,173 | 0.8% | + 13.1% | 35 | 34 |
| 39 | Kia Sorento | 967 | 0.8% | + 0.1% | 35 | 5,165 | 0.8% | – 7.2% | 36 | 38 |
| 40 | Toyota Yaris Cross | 962 | 0.8% | + 83.9% | 27 | 5,887 | 0.9% | + 59.2% | 29 | 46 |
| 41 | Toyota Hiace | 961 | 0.8% | – 37.1% | 19 | 7,400 | 1.2% | + 9.7% | 23 | 23 |
| 42 | MG 3 | 914 | 0.7% | – 29.0% | 42 | 5,286 | 0.8% | – 14.0% | 33 | 28 |
| 43 | Hyundai Venue | 843 | 0.7% | + 42.4% | 47 | 3,940 | 0.6% | + 20.5% | 45 | 51 |
| 44 | Geely EX5 | 822 | 0.6% | new | 57 | 1,845 | 0.3% | new | 73 | – |
| 45 | VW Tiguan/Allspace | 815 | 0.6% | – 21.3% | 39 | 3,877 | 0.6% | – 24.6% | 46 | 43 |
| 46 | Nissan Navara | 788 | 0.6% | – 30.6% | 50 | 4,488 | 0.7% | – 20.5% | 40 | 35 |
| 47 | Kia Seltos | 782 | 0.6% | – 13.4% | 38 | 4,433 | 0.7% | – 2.3% | 41 | 48 |
| 48 | Kia K4 | 772 | 0.6% | new | 52 | 2,503 | 0.4% | new | 56 | – |
| 49 | Toyota Camry | 739 | 0.6% | – 63.3% | 34 | 4,259 | 0.7% | – 60.5% | 44 | 20 |
| 50 | Suzuki Jimny | 736 | 0.6% | – 7.4% | 44 | 4,365 | 0.7% | – 7.3% | 43 | 39 |
| 51 | Nissan Patrol | 724 | 0.6% | + 8.2% | 46 | 3,779 | 0.6% | – 4.2% | 47 | 45 |
Source: VFACTS