USA Q3 2024: Market down -2.1%, Chevrolet Trax in Top 10
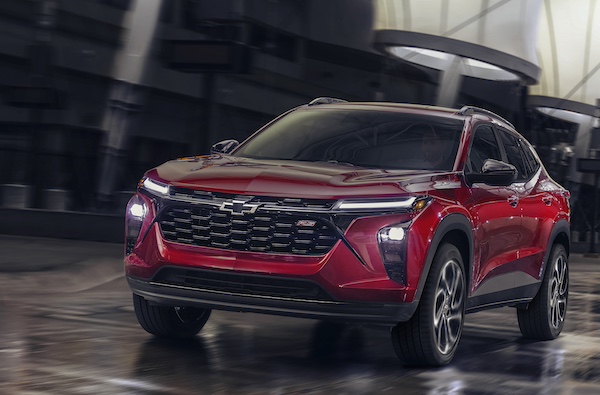 Chevrolet Trax sales are up 56.6% over Q3.
According to Cox Automotive, the U.S. new light vehicle market drops -12.8% year-on-year in September to 1.17 million units. This is partly because of fewer selling days 23 against 26 in September 2023. The SAAR stands at 15.8 million, identical to September 2023. Light truck sales are down -10.5% to 952,000 and passenger cars freefall -17.7% to 225,000. The Q3 tally is off -2.1% to 3.9 million while the year-to-date total edges up 0.9% to 11.787 million. Fleet sales are up 7% year-to-date, leasing is up 24% and retail sales down -4%. Cox Automotive forecasts 15.7 million sales over the Full year 2024, as the recent interest cut and more aggressive discounts could help sales improve over Q4.
Over Q3, General Motors edges down -1.9% to keep the lead ahead of a struggling Toyota Motor (-8%). Ford Motor (+0.7%) and American Honda (+8%) defy the negative market while Hyundai-Kia (-0.3%) is stable. Stellantis (-19.8%) is in hell, Nissan Motor/Mitsubishi (+1.9%) is relatively solid and Volkswagen Group (-4.7%) disappoints.
Brand-wise, Ford (-0.4%) snaps the top spot off Toyota (-10.4%) but remains #2 year-to-date where it gains 1.8% vs. +5.5% for Toyota. Chevrolet (-6%) follows ahead of Honda (+10.2%) and Hyundai (+5.2%) both in great shape. Kia (-6%), Nissan (-1.4%) and Tesla (-2.4%) drop in the remainder of the Top 10 whereas GMC (+6.4%) and Subaru (+4.9%) gain ground. Below, Mitsubishi (+42.3%), Land Rover (+28%), Lincoln (+26.1%), Mazda (+24.9%) and Mercedes (+13.9%) stand out.
The Ford F-Series (+4.2%) easily remains the most popular nameplate in the country and expands its gap with the #2, the Chevrolet Silverado (-7.3%). The Tesla Model Y (+14.8%) is estimated to climb into third place, dislodging a Toyota RAV4 (-11.9%) in difficulty. In fact the RAV4’s margin over its archenemy the Honda CR-V is only 76 sales over Q3. The Ram Pickup (-18.5%) continues to freefall and ranks #6 year-to-date vs. #3 over the Full Year 2023. Below the GMC Sierra (+10.1%) and Toyota Camry (+7.6%) both solid, we have a fantastic performance of the Chevrolet Trax (+56.6%) breaking into the Top 10 at #9. The Honda Civic (+10.8%) also impresses and shoots up from #16 over FY2023 to #10 YTD.
Previous month: USA August 2024: Mazda (+36.7%), Honda (+28.2%) highlight positive market
One year ago: USA Q3 2023: Honda (+50.9%), Nissan (+40.2%), Tesla (+37.9%) impress, market up 16.7%
Full Q3 2024 Top 15 groups, Top 47 brands and Top 307 models below.
USA Q3 2024 – groups:
| Pos | Group | Q3 2024 | /23 | 2024 | /23 | Pos | FY23 |
| 1 | General Motors | 656,531 | – 1.9% | 1,938,266 | – 1.0% | 1 | 1 |
| 2 | Toyota Motor Corporation | 542,876 | – 8.0% | 1,729,523 | + 6.2% | 2 | 2 |
| 3 | Ford Motor Co | 500,495 | + 0.7% | 1,537,776 | + 2.7% | 3 | 3 |
| 4 | Hyundai-Kia | 428,798 | – 0.3% | 1,246,602 | – 0.3% | 4 | 4 |
| 5 | American Honda | 366,214 | + 8.0% | 1,056,495 | + 8.8% | 5 | 6 |
| 6 | Stellantis | 306,064 | – 19.8% | 987,698 | – 16.9% | 6 | 5 |
| 7 | Nissan Motor/Mitsubishi | 243,656 | + 1.9% | 784,242 | + 2.5% | 7 | 7 |
| 8 | Subaru | 171,169 | + 4.9% | 493,612 | + 5.6% | 8 | 10 |
| 9 | Volkswagen Group | 161,278 | – 4.7% | 474,698 | + 2.7% | 9 | 9 |
| 10 | Tesla | 152,829 | – 2.4% | 457,280 | – 7.3% | 10 | 8 |
| 11 | Mazda | 110,966 | + 24.9% | 313,452 | + 15.0% | 11 | 12 |
| 12 | Mercedes-Benz | 97,806 | + 13.9% | 276,025 | + 1.2% | 12 | 13 |
| 13 | BMW Group | 83,812 | – 9.3% | 272,717 | – 2.1% | 13 | 11 |
| 14 | Jaguar Land Rover | 30,670 | + 29.6% | 89,060 | + 29.0% | 15 | 15 |
| 15 | Volvo Cars | 28,535 | – 11.9% | 89,547 | – 2.8% | 14 | 14 |
USA Q3 2024 – brands:
| Pos | Brand | Q3 2024 | /23 | 2024 | /23 | Pos | FY23 |
| 1 | Ford | 474,782 | – 0.4% | 1,463,246 | + 1.8% | 2 | 2 |
| 2 | Toyota | 461,879 | – 10.4% | 1,481,315 | + 5.5% | 1 | 1 |
| 3 | Chevrolet | 419,801 | – 6.0% | 1,253,091 | – 3.0% | 3 | 3 |
| 4 | Honda | 333,105 | + 10.2% | 959,371 | + 11.5% | 4 | 4 |
| 5 | Hyundai | 210,971 | + 5.2% | 610,494 | + 2.6% | 6 | 6 |
| 6 | Kia | 197,710 | – 6.0% | 584,171 | – 3.4% | 7 | 7 |
| 7 | Nissan | 197,528 | – 1.4% | 658,957 | + 1.7% | 5 | 5 |
| 8 | Subaru | 171,169 | + 4.9% | 493,612 | + 5.6% | 8 | 10 |
| 9 | Tesla | 152,829 | – 2.4% | 457,280 | – 7.3% | 9 | 8 |
| 10 | GMC | 151,865 | + 6.4% | 435,828 | + 1.5% | 11 | 11 |
| 11 | Jeep | 144,963 | – 6.2% | 449,149 | – 8.4% | 10 | 9 |
| 12 | Mazda | 110,966 | + 24.9% | 313,452 | + 15.0% | 12 | 13 |
| 13 | Ram | 108,925 | – 18.9% | 309,718 | – 23.5% | 13 | 12 |
| 14 | Mercedes | 97,806 | + 13.9% | 276,025 | + 1.2% | 14 | 15 |
| 15 | Volkswagen | 93,271 | + 6.3% | 275,984 | + 18.7% | 15 | 16 |
| 16 | Lexus | 80,997 | + 8.1% | 248,208 | + 10.7% | 17 | 17 |
| 17 | BMW | 78,128 | – 6.9% | 253,840 | – 0.2% | 16 | 14 |
| 18 | Buick | 47,405 | + 7.8% | 137,235 | + 9.9% | 19 | 20 |
| 19 | Audi | 46,752 | – 21.5% | 139,665 | – 16.8% | 18 | 18 |
| 20 | Cadillac | 37,214 | + 4.4% | 111,120 | + 0.3% | 21 | 21 |
| 21 | Acura | 33,109 | – 10.3% | 97,124 | – 12.1% | 22 | 22 |
| 22 | Mitsubishi | 31,588 | + 42.3% | 82,718 | + 22.1% | 25 | 25 |
| 23 | Volvo | 28,535 | – 11.9% | 89,547 | – 2.8% | 24 | 24 |
| 24 | Land Rover | 27,000 | + 28.0% | 76,650 | + 28.1% | 26 | 30 |
| 25 | Dodge | 26,559 | – 42.5% | 119,294 | – 24.0% | 20 | 19 |
| 26 | Lincoln | 25,713 | + 26.1% | 74,530 | + 25.4% | 27 | 26 |
| 27 | Chrysler | 22,482 | – 46.9% | 97,055 | – 21.3% | 23 | 23 |
| 28 | Rivian | 20,900 | + 7.7% | 46,021 | + 27.1% | 30 | 31 |
| 29 | Genesis | 20,117 | + 3.6% | 51,938 | + 2.5% | 29 | 28 |
| 30 | Porsche | 19,350 | – 3.2% | 54,083 | – 4.0% | 28 | 27 |
| 31 | Infiniti | 14,540 | – 12.1% | 42,567 | – 12.8% | 31 | 29 |
| 32 | Mini | 5,284 | – 33.1% | 17,551 | – 22.9% | 32 | 32 |
| 33 | Polestar | 4,000 | + 90.5% | 7,400 | – 6.8% | 34 | 34 |
| 34 | Jaguar | 3,670 | + 42.8% | 10,410 | + 36.6% | 33 | 35 |
| 35 | Alfa Romeo | 2,049 | – 29.1% | 6,826 | – 10.1% | 35 | 33 |
| 36 | VinFast | 1,500 | + 900.0% | 2,500 | + 1328.6% | 39 | 47 |
| 37 | Lucid | 1,200 | + 50.0% | 2,300 | + 5.0% | 41 | 39 |
| 38 | Lamborghini | 1,030 | + 3.0% | 2,526 | – 1.7% | 38 | 38 |
| 39 | Bentley | 875 | – 2.8% | 2,440 | – 15.7% | 40 | 37 |
| 40 | Maserati | 770 | – 21.4% | 4,870 | + 6.3% | 36 | 36 |
| 41 | Ferrari | 710 | + 5.2% | 2,280 | + 12.0% | 42 | 40 |
| 42 | Aston Martin | 435 | – 5.6% | 1,425 | + 10.0% | 44 | 43 |
| 43 | Rolls Royce | 400 | – 23.8% | 1,325 | – 6.0% | 45 | 42 |
| 44 | McLaren | 400 | + 37.9% | 935 | + 11.3% | 47 | 44 |
| 45 | Fiat | 316 | + 117.9% | 786 | + 84.1% | 48 | 45 |
| 46 | BrightDrop | 246 | + 602.9% | 992 | + 197.9% | 46 | 46 |
| 47 | Lotus | 150 | + 1400.0% | 430 | + 437.5% | 49 | 49 |
USA Q3 2024 – models:
| Pos | Model | Q3 2024 | /23 | 2024 | /23 | Pos | FY23 |
| 1 | Ford F-Series | 198,429 | + 4.2% | 550,835 | – 3.9% | 1 | 1 |
| 2 | Chevrolet Silverado | 129,164 | – 7.3% | 404,856 | + 0.4% | 2 | 2 |
| 3 | Tesla Model Y (est) | 104,943 | + 14.8% | 306,140 | + 2.6% | 4 | 5 |
| 4 | Toyota RAV4 | 102,036 | – 11.9% | 350,331 | + 15.7% | 3 | 4 |
| 5 | Honda CR-V | 101,960 | + 3.4% | 298,164 | + 13.7% | 5 | 6 |
| 6 | Ram Pickup | 89,140 | – 18.5% | 268,666 | – 19.2% | 6 | 3 |
| 7 | GMC Sierra | 80,613 | + 10.1% | 229,398 | + 6.1% | 7 | 7 |
| 8 | Toyota Camry | 72,334 | + 7.6% | 227,576 | + 4.4% | 8 | 8 |
| 9 | Chevrolet Trax | 59,299 | + 56.6% | 149,762 | + 129.5% | 14 | 44 |
| 10 | Honda Civic | 58,634 | + 10.8% | 188,422 | + 28.3% | 10 | 16 |
| 11 | Toyota Tacoma | 57,368 | – 8.7% | 126,805 | – 29.4% | 19 | 11 |
| 12 | Toyota Corolla | 55,101 | – 19.2% | 177,092 | + 6.9% | 11 | 12 |
| 13 | Jeep Grand Cherokee | 54,188 | – 6.4% | 160,939 | – 12.0% | 12 | 10 |
| 14 | Hyundai Tucson | 53,801 | + 2.3% | 145,947 | – 4.7% | 16 | 15 |
| 15 | Subaru Crosstrek | 52,347 | + 36.0% | 131,847 | + 15.0% | 17 | 21 |
| 16 | Nissan Rogue | 47,996 | – 24.2% | 189,156 | – 10.4% | 9 | 9 |
| 17 | Chevrolet Equinox | 46,840 | – 3.0% | 154,308 | + 0.1% | 13 | 13 |
| 18 | Subaru Outback | 44,630 | + 7.6% | 126,333 | + 2.8% | 20 | 20 |
| 19 | Honda Accord | 43,968 | – 16.0% | 124,689 | – 18.1% | 21 | 17 |
| 20 | Ford Explorer | 41,996 | + 24.6% | 146,799 | + 6.3% | 15 | 18 |
| 21 | Hyundai Elantra | 39,329 | + 20.8% | 101,618 | – 5.3% | 32 | 27 |
| 22 | Toyota Tundra | 39,069 | + 18.6% | 117,523 | + 26.8% | 24 | 33 |
| 23 | Kia Sportage | 38,905 | + 9.0% | 118,758 | + 10.4% | 23 | 26 |
| 24 | Honda HR-V | 38,542 | + 16.4% | 114,805 | + 31.9% | 25 | 36 |
| 25 | Subaru Forester | 37,249 | – 17.3% | 130,098 | + 22.3% | 18 | 24 |
| 26 | Honda Pilot | 36,832 | + 38.4% | 103,115 | + 25.1% | 31 | 43 |
| 27 | Ford Escape | 35,938 | – 7.3% | 110,476 | + 6.6% | 28 | 25 |
| 28 | Jeep Wrangler | 35,874 | – 14.4% | 113,078 | – 10.6% | 27 | 22 |
| 29 | Nissan Sentra | 34,704 | + 9.8% | 123,732 | + 38.9% | 22 | 45 |
| 30 | Jeep Compass | 34,632 | + 70.9% | 84,474 | + 18.0% | 40 | 48 |
| 31 | Ford Bronco Sport | 34,603 | + 4.1% | 94,357 | – 2.1% | 35 | 32 |
| 32 | Mazda CX-5 | 33,841 | – 5.6% | 104,055 | – 10.2% | 30 | 23 |
| 33 | Ford Transit | 32,117 | – 5.6% | 114,281 | + 16.6% | 26 | 30 |
| 34 | Ford Maverick | 31,883 | + 33.2% | 108,996 | + 64.1% | 29 | 49 |
| 35 | Kia Forte | 30,620 | – 7.4% | 101,093 | + 5.2% | 33 | 34 |
| 36 | Tesla Model 3 (est) | 30,566 | – 43.8% | 99,483 | – 36.2% | 34 | 14 |
| 37 | Chevrolet Trailblazer | 29,609 | – 3.5% | 81,708 | – 11.6% | 45 | 40 |
| 38 | Chevrolet Colorado | 28,887 | + 13.2% | 70,710 | + 20.5% | 50 | 66 |
| 39 | Chevrolet Traverse | 28,390 | – 12.2% | 69,852 | – 30.8% | 51 | 35 |
| 40 | Lexus RX | 28,386 | + 8.7% | 83,341 | – 0.2% | 42 | 39 |
| 41 | Kia Telluride | 28,054 | – 2.2% | 81,754 | – 2.7% | 44 | 41 |
| 42 | Hyundai Palisade | 28,045 | + 44.5% | 81,792 | + 39.0% | 43 | 50 |
| 43 | Hyundai Santa Fe | 27,059 | – 22.7% | 83,681 | – 13.0% | 41 | 28 |
| 44 | Ford Bronco | 26,796 | – 18.5% | 76,948 | – 15.9% | 47 | 47 |
| 45 | Nissan Altima | 26,783 | – 8.5% | 86,679 | – 6.3% | 39 | 31 |
| 46 | Chevrolet Malibu | 24,424 | – 26.6% | 93,533 | – 16.1% | 36 | 29 |
| 47 | Chevrolet Tahoe | 23,337 | – 15.4% | 71,780 | – 14.6% | 49 | 42 |
| 48 | Mazda CX-50 | 23,318 | + 127.4% | 58,515 | + 84.5% | 61 | 95 |
| 49 | Toyota 4Runner | 22,641 | – 36.9% | 89,201 | + 3.0% | 38 | 38 |
| 50 | Kia Sorento | 22,513 | – 9.3% | 69,176 | + 2.3% | 52 | 51 |
| 51 | Toyota Corolla Cross | 22,507 | + 8.1% | 67,674 | + 37.7% | 53 | 65 |
| 52 | Mazda CX-30 | 22,358 | + 7.6% | 73,580 | + 24.1% | 48 | 55 |
| 53 | Chrysler Pacifica | 21,504 | – 43.9% | 92,386 | – 17.7% | 37 | 37 |
| 54 | VW Tiguan | 21,231 | + 25.5% | 63,895 | + 14.7% | 56 | 56 |
| 55 | Mercedes GLC | 20,302 | + 76.5% | 46,407 | + 63.3% | 76 | 103 |
| 56 | Honda Odyssey | 19,991 | + 18.3% | 59,248 | + 5.1% | 58 | 58 |
| 57 | Ram ProMaster Van | 19,781 | – 11.9% | 41,003 | – 32.0% | 81 | 53 |
| 58 | VW Jetta | 19,379 | + 35.2% | 52,911 | + 73.2% | 68 | 92 |
| 59 | GMC Yukon/XL | 19,331 | – 8.6% | 58,793 | – 6.9% | 60 | 52 |
| 60 | Nissan Pathfinder | 19,330 | + 41.4% | 58,896 | + 4.3% | 59 | 64 |
| 61 | Nissan Kicks | 19,153 | – 5.8% | 52,144 | + 4.0% | 69 | 68 |
| 62 | Chevrolet Blazer | 19,055 | + 22.8% | 55,777 | + 14.2% | 63 | 71 |
| 63 | Lexus NX | 18,876 | + 7.0% | 53,515 | + 3.5% | 67 | 59 |
| 64 | VW Atlas | 18,718 | + 16.4% | 54,271 | + 30.7% | 65 | 77 |
| 65 | Hyundai Kona | 17,969 | – 3.4% | 64,508 | + 14.1% | 55 | 54 |
| 66 | Toyota Sienna | 17,921 | – 9.5% | 50,789 | + 6.4% | 70 | 69 |
| 67 | Hyundai Sonata | 17,283 | + 72.7% | 48,430 | + 29.7% | 72 | 93 |
| 68 | Toyota Highlander | 17,179 | – 31.0% | 77,287 | – 44.1% | 46 | 19 |
| 69 | GMC Terrain | 16,164 | – 4.9% | 65,287 | + 19.5% | 54 | 63 |
| 70 | Kia K5 | 15,669 | – 16.2% | 28,476 | – 42.6% | 109 | 72 |
| 71 | Mazda CX-90 | 15,603 | + 34.9% | 38,562 | + 123.3% | 86 | 124 |
| 72 | Ford Ranger | 15,504 | + 109.9% | 30,679 | – 2.6% | 100 | 119 |
| 73 | VW Taos | 15,397 | – 6.2% | 47,673 | + 9.4% | 74 | 81 |
| 74 | Kia Seltos | 15,391 | + 5.2% | 48,177 | + 2.4% | 73 | 80 |
| 75 | BMW X3 | 15,319 | + 4.4% | 49,908 | + 17.7% | 71 | 74 |
| 76 | Mercedes GLE | 15,274 | + 13.4% | 46,150 | + 4.9% | 77 | 83 |
| 77 | Buick Envista | 15,004 | + 178.6% | 38,880 | + 622.0% | 85 | 182 |
| 78 | Toyota Land Cruiser | 14,835 | + 741650.0% | 18,296 | + 304833.3% | 144 | 317 |
| 79 | Ford Expedition | 14,817 | – 13.2% | 58,124 | + 3.0% | 62 | 61 |
| 80 | Audi Q5 | 14,677 | – 24.2% | 39,248 | – 28.3% | 84 | 60 |
| 81 | Buick Encore GX | 14,675 | – 26.8% | 44,646 | – 11.4% | 79 | 73 |
| 82 | Subaru Ascent | 14,659 | + 6.7% | 42,614 | – 9.1% | 80 | 78 |
| 83 | GMC Acadia | 14,455 | – 6.1% | 32,137 | – 42.1% | 97 | 70 |
| 84 | Nissan Frontier | 14,294 | + 21.6% | 54,257 | + 18.2% | 66 | 82 |
| 85 | Dodge Durango | 13,949 | – 15.3% | 46,870 | – 12.5% | 75 | 67 |
| 86 | Kia Carnival | 13,644 | – 11.1% | 34,727 | + 4.7% | 92 | 97 |
| 87 | Mitsubishi Outlander | 13,417 | + 19.5% | 40,804 | + 5.6% | 82 | 89 |
| 88 | Ford Mustang Mach-E | 13,392 | – 9.8% | 35,626 | + 23.4% | 91 | 101 |
| 89 | Chevrolet Express | 13,338 | + 4.8% | 30,250 | – 1.0% | 104 | 102 |
| 90 | Toyota Prius | 13,269 | + 2.5% | 28,642 | + 2.7% | 108 | 109 |
| 91 | Honda Ridgeline | 13,112 | + 8.0% | 33,034 | – 16.5% | 94 | 87 |
| 92 | Honda Prologue | 12,644 | new | 14,179 | new | 166 | – |
| 93 | Buick Envision | 12,565 | + 72.6% | 34,425 | – 1.2% | 93 | 96 |
| 94 | BMW X5 | 12,425 | – 22.3% | 46,025 | – 11.3% | 78 | 62 |
| 95 | Acura RDX | 12,044 | + 4.5% | 32,178 | + 18.3% | 96 | 107 |
| 96 | Lexus GX | 11,765 | + 44.0% | 20,906 | – 2.7% | 129 | 121 |
| 97 | Rivian R1T | 11,700 | + 154.3% | 16,312 | + 32.0% | 154 | 175 |
| 98 | Kia Soul | 11,629 | – 24.1% | 40,094 | – 19.9% | 83 | 76 |
| 99 | Hyundai Ioniq 5 | 11,590 | – 0.6% | 30,318 | + 19.8% | 102 | 117 |
| 100 | Nissan Versa | 11,490 | + 68.1% | 29,302 | + 64.2% | 107 | 139 |
| 101 | BMW 4 Series | 11,419 | – 16.5% | 31,354 | – 20.5% | 99 | 88 |
| 102 | Mercedes Sprinter | 11,364 | – 23.9% | 36,725 | – 18.1% | 89 | 79 |
| 103 | Acura MDX | 11,151 | – 13.9% | 36,845 | – 18.0% | 88 | 84 |
| 104 | Lexus ES | 10,726 | + 11.5% | 30,284 | + 4.6% | 103 | 108 |
| 105 | Mazda3 | 10,241 | + 24.3% | 28,068 | + 20.1% | 111 | 125 |
| 106 | Mitsubishi Mirage | 10,162 | + 152.3% | 20,024 | + 114.3% | 134 | 184 |
| 107 | GMC Canyon | 10,121 | + 32.7% | 26,956 | + 39.3% | 114 | 149 |
| 108 | Mercedes C Class | 9,828 | + 22.0% | 27,257 | + 9.1% | 113 | 118 |
| 109 | Ford Edge | 9,733 | – 59.8% | 61,412 | – 13.1% | 57 | 46 |
| 110 | VW Atlas Cross Sport | 9,323 | + 5.7% | 28,158 | + 17.2% | 110 | 113 |
| 111 | Jeep Gladiator | 9,192 | – 35.3% | 32,670 | – 21.3% | 95 | 85 |
| 112 | Ford E-Series | 9,179 | – 16.4% | 29,447 | – 3.5% | 106 | 99 |
| 113 | Chevrolet Suburban | 9,049 | – 25.1% | 30,512 | – 28.5% | 101 | 86 |
| 114 | Ford Mustang | 9,041 | – 8.2% | 36,485 | + 3.3% | 90 | 90 |
| 115 | Lincoln Nautilus | 8,799 | + 34.5% | 26,303 | + 39.2% | 116 | 143 |
| 116 | Cadillac Escalade/ESV | 8,788 | – 17.9% | 27,992 | – 11.1% | 112 | 100 |
| 117 | Volvo XC90 | 8,636 | – 19.5% | 26,827 | – 5.6% | 115 | 104 |
| 118 | Land Rover Defender | 8,500 | + 35.7% | 18,966 | + 40.9% | 143 | 155 |
| 119 | Genesis GV70 | 8,299 | + 19.1% | 20,480 | + 9.1% | 131 | 137 |
| 120 | Toyota Venza | 8,263 | – 8.3% | 29,790 | + 34.9% | 105 | 126 |
| 121 | Subaru Impreza | 8,181 | + 3.9% | 23,073 | – 15.1% | 123 | 114 |
| 122 | Volvo XC60 | 7,951 | – 14.7% | 25,778 | – 11.6% | 117 | 105 |
| 123 | Chevrolet Corvette | 7,797 | – 7.3% | 25,711 | + 1.1% | 118 | 115 |
| 124 | BMW 3 Series | 7,641 | – 13.8% | 21,778 | – 6.4% | 124 | 116 |
| 125 | Tesla Cybertruck (est) | 7,641 | new | 19,899 | new | 135 | 306 |
| 126 | Jeep Wagoneer | 7,562 | + 4.3% | 37,427 | + 79.2% | 87 | 128 |
| 127 | Honda Passport | 7,422 | – 22.2% | 23,715 | – 28.9% | 122 | 98 |
| 128 | Audi Q3 | 7,422 | + 36.0% | 21,743 | + 51.2% | 125 | 152 |
| 129 | Hyundai Santa Cruz | 7,226 | – 20.0% | 25,171 | – 13.5% | 119 | 111 |
| 130 | Cadillac Lyriq | 7,224 | + 139.4% | 20,318 | + 280.9% | 133 | 214 |
| 131 | Kia Niro | 7,030 | – 28.0% | 25,132 | – 13.6% | 120 | 112 |
| 132 | Volvo XC40 | 6,950 | – 7.1% | 19,822 | + 1.0% | 137 | 131 |
| 133 | Infiniti QX60 | 6,941 | – 8.1% | 20,355 | – 9.2% | 132 | 127 |
| 134 | Lincoln Corsair | 6,887 | – 12.3% | 19,736 | + 12.9% | 138 | 142 |
| 135 | GMC Savana | 6,876 | – 4.4% | 14,355 | – 25.5% | 165 | 154 |
| 136 | Genesis GV80 | 6,711 | + 23.6% | 16,802 | + 22.8% | 152 | 160 |
| 137 | Mercedes GLA | 6,703 | + 165.0% | 13,449 | + 11.0% | 171 | 189 |
| 138 | Tesla Model X (est) | 6,623 | – 6.2% | 21,387 | + 39.8% | 126 | 151 |
| 139 | Range Rover | 6,600 | + 56.0% | 15,298 | + 35.6% | 160 | 174 |
| 140 | Hyundai Venue | 6,472 | – 0.6% | 19,843 | – 13.2% | 136 | 132 |
| 141 | Mercedes GLS | 6,460 | + 21.9% | 20,707 | + 20.1% | 130 | 144 |
| 142 | Toyota Sequoia | 6,422 | + 3.4% | 19,290 | + 22.2% | 140 | 153 |
| 143 | Range Rover Sport | 6,300 | + 119.0% | 13,834 | + 91.4% | 167 | 196 |
| 144 | Kia EV9 | 6,299 | new | 15,970 | new | 156 | 280 |
| 145 | Porsche Macan | 5,989 | – 20.4% | 17,993 | – 17.6% | 146 | 133 |
| 146 | Mercedes CLE | 5,754 | new | 10,037 | new | 189 | – |
| 147 | Cadillac XT5 | 5,679 | – 8.6% | 17,844 | – 12.2% | 147 | 134 |
| 148 | Audi Q7 | 5,658 | – 30.7% | 13,550 | – 36.8% | 169 | 129 |
| 149 | Cadillac XT4 | 5,655 | + 6.7% | 15,688 | – 11.9% | 157 | 147 |
| 150 | BMW X1 | 5,597 | – 1.8% | 17,214 | + 33.4% | 150 | 157 |
| 151 | Nissan Ariya | 5,552 | + 23.3% | 14,897 | + 53.6% | 161 | 181 |
| 152 | Lincoln Aviator | 5,543 | + 278.9% | 17,457 | + 80.4% | 148 | 176 |
| 153 | Acura Integra | 5,498 | – 33.9% | 19,136 | – 22.9% | 142 | 120 |
| 154 | Porsche Cayenne | 5,339 | – 0.5% | 15,507 | + 8.6% | 159 | 159 |
| 155 | BMW X7 | 5,328 | – 11.2% | 19,679 | – 1.3% | 139 | 130 |
| 156 | Audi A5 | 5,302 | – 12.2% | 18,128 | – 0.9% | 145 | 145 |
| 157 | Nissan Murano | 5,298 | + 3.5% | 14,437 | – 45.1% | 163 | 122 |
| 158 | Subaru Legacy | 5,192 | – 32.2% | 14,642 | – 25.4% | 162 | 138 |
| 159 | Buick Enclave | 5,161 | – 51.1% | 19,148 | – 32.8% | 141 | 106 |
| 160 | Dodge Charger | 5,104 | – 69.8% | 31,980 | – 49.8% | 98 | 57 |
| 161 | Kia EV6 | 5,044 | – 22.0% | 15,985 | + 8.0% | 155 | 164 |
| 162 | Rivian EDV | 5,000 | + 733.3% | 8,297 | + 991.7% | 201 | 284 |
| 163 | Mercedes CLA Class | 4,717 | + 69.4% | 8,312 | + 1.9% | 200 | 207 |
| 164 | BMW iX | 4,679 | – 15.6% | 11,169 | – 7.1% | 180 | 170 |
| 165 | VW ID.4 | 4,518 | – 57.8% | 16,375 | – 39.7% | 153 | 110 |
| 166 | Nissan Leaf | 4,514 | + 187.5% | 7,581 | + 30.6% | 205 | 223 |
| 167 | Lincoln Navigator | 4,484 | – 0.9% | 11,034 | – 17.6% | 181 | 167 |
| 168 | VW Golf | 4,442 | + 17.1% | 11,513 | + 40.9% | 178 | 199 |
| 169 | Cadillac XT6 | 4,342 | + 6.0% | 13,387 | – 5.5% | 172 | 162 |
| 170 | GMC Hummer EV | 4,305 | + 268.9% | 8,902 | + 632.1% | 193 | 247 |
| 171 | Subaru WRX | 4,250 | – 18.3% | 13,545 | – 34.2% | 170 | 140 |
| 172 | Lexus IS | 4,242 | – 29.9% | 14,391 | – 16.2% | 164 | 148 |
| 173 | Rivian R1S | 4,200 | – 62.8% | 21,343 | + 12.3% | 127 | 146 |
| 174 | Mitsubishi Eclipse Cross | 4,196 | + 26.7% | 10,184 | + 33.2% | 188 | 206 |
| 175 | Cadillac CT5 | 4,128 | – 6.4% | 10,991 | – 23.7% | 182 | 165 |
| 176 | Porsche 911 | 4,121 | + 32.3% | 10,841 | + 23.7% | 183 | 194 |
| 177 | Toyota bZ4X | 4,109 | + 45.3% | 13,577 | + 109.3% | 168 | 212 |
| 178 | Polestar 2 | 4,000 | + 90.5% | 7,400 | – 6.1% | 208 | 208 |
| 179 | Nissan Titan | 3,976 | – 18.1% | 12,185 | – 20.9% | 175 | 161 |
| 180 | BMW 2 Series | 3,937 | + 25.6% | 10,373 | + 41.6% | 185 | 195 |
| 181 | Dodge Hornet | 3,848 | + 119.5% | 15,566 | + 257.8% | 158 | 213 |
| 182 | Mazda CX-70 | 3,829 | new | 4,888 | new | 224 | – |
| 183 | Mitsubishi Outlander Sport | 3,813 | + 5.0% | 11,706 | – 3.4% | 177 | 177 |
| 184 | Subaru Solterra | 3,752 | + 34.4% | 9,137 | + 58.5% | 191 | 218 |
| 185 | Dodge Challenger | 3,657 | – 67.0% | 24,874 | – 29.6% | 121 | 94 |
| 186 | Nissan Armada | 3,578 | – 21.1% | 12,411 | – 30.0% | 173 | 156 |
| 187 | Mercedes E Class/CLS | 3,446 | – 28.6% | 11,510 | – 2.0% | 179 | 171 |
| 188 | Toyota Crown | 3,402 | – 50.7% | 17,333 | + 32.8% | 149 | 163 |
| 189 | Mercedes GLB | 3,108 | – 39.2% | 12,150 | – 3.0% | 176 | 173 |
| 190 | Volvo S60 | 3,090 | + 11.7% | 12,360 | + 102.9% | 174 | 202 |
| 191 | Tesla Model S (est) | 3,057 | – 28.7% | 10,371 | – 22.3% | 186 | 169 |
| 192 | Genesis G70 | 3,042 | – 31.7% | 8,538 | – 20.1% | 196 | 183 |
| 193 | Audi Q4 e-tron | 2,975 | + 21.6% | 8,083 | + 33.3% | 202 | 221 |
| 194 | Mercedes EQB SUV | 2,917 | – 10.8% | 6,761 | – 5.6% | 214 | 193 |
| 195 | Kia K4 | 2,911 | new | 2,911 | new | 239 | – |
| 196 | BMW X4 | 2,805 | + 41.8% | 7,491 | + 18.0% | 206 | 210 |
| 197 | Mini Cooper | 2,803 | – 43.2% | 10,675 | – 26.6% | 184 | 158 |
| 198 | Lexus RZ | 2,742 | + 96.7% | 8,381 | + 233.8% | 199 | 236 |
| 199 | Infiniti QX50 | 2,721 | + 11.7% | 7,877 | + 10.1% | 203 | 205 |
| 200 | Infiniti QX80 | 2,694 | – 13.0% | 7,410 | – 19.7% | 207 | 188 |
| 201 | Acura ZDX | 2,676 | new | 3,014 | new | 238 | – |
| 202 | Jeep Grand Wagoneer | 2,630 | – 8.3% | 10,185 | + 25.2% | 187 | 200 |
| 203 | Audi Q8 | 2,596 | – 30.0% | 6,965 | – 30.7% | 210 | 180 |
| 204 | BMW 5 Series | 2,508 | + 44.7% | 17,168 | + 3.6% | 151 | 150 |
| 205 | Mini Countryman | 2,481 | – 16.4% | 6,876 | – 16.4% | 213 | 190 |
| 206 | Range Rover Velar | 2,300 | + 51.0% | 4,648 | – 12.0% | 227 | 225 |
| 207 | Toyota Crown Signia | 2,281 | new | 2,281 | new | 251 | – |
| 208 | Audi A6 | 2,217 | – 6.8% | 6,453 | + 9.4% | 215 | 219 |
| 209 | Hyundai Ioniq 6 | 2,185 | – 56.9% | 9,097 | + 9.4% | 192 | 186 |
| 210 | Toyota GR86 | 2,176 | – 37.4% | 9,643 | + 10.4% | 190 | 197 |
| 211 | Jaguar F-Pace | 2,000 | + 92.7% | 4,555 | + 20.1% | 228 | 238 |
| 212 | BMW X6 | 1,961 | – 9.3% | 5,694 | – 19.4% | 222 | 203 |
| 213 | Mazda MX-5 Miata | 1,776 | – 13.6% | 5,780 | – 23.6% | 220 | 217 |
| 214 | BMW 7 Series | 1,770 | – 25.5% | 6,908 | – 8.8% | 211 | 198 |
| 215 | Audi Q8 e-tron | 1,745 | – 36.5% | 6,365 | + 80.5% | 216 | 229 |
| 216 | Acura TLX | 1,740 | – 57.5% | 5,951 | – 56.2% | 218 | 172 |
| 217 | Porsche 718 | 1,709 | + 77.5% | 3,821 | + 18.0% | 232 | 240 |
| 218 | Mercedes G Class | 1,642 | – 15.1% | 7,119 | – 9.5% | 209 | 204 |
| 219 | Range Rover Evoque | 1,600 | + 136.3% | 3,258 | + 11.4% | 235 | 243 |
| 220 | Lexus UX | 1,509 | – 41.3% | 6,881 | – 26.6% | 212 | 192 |
| 221 | VinFast VF8 | 1,500 | + 900.0% | 2,500 | + 1328.6% | 245 | 299 |
| 222 | Lexus LX | 1,497 | – 18.1% | 4,812 | – 8.8% | 225 | 224 |
| 223 | Mercedes Metris | 1,405 | – 64.6% | 3,031 | – 55.0% | 237 | 211 |
| 224 | Cadillac CT4 | 1,398 | – 26.5% | 4,900 | – 33.2% | 223 | 215 |
| 225 | Audi A3 | 1,368 | – 51.3% | 8,415 | – 20.8% | 198 | 178 |
| 226 | Audi A4 | 1,356 | – 46.2% | 5,992 | – 45.1% | 217 | 179 |
| 227 | Ford Transit Connect | 1,354 | – 74.8% | 8,781 | – 37.8% | 194 | 166 |
| 228 | Porsche Taycan | 1,340 | – 27.9% | 3,394 | – 32.4% | 234 | 222 |
| 229 | Mercedes EQE SUV | 1,331 | – 61.8% | 8,511 | + 34.4% | 197 | 201 |
| 230 | Infiniti Q50 | 1,299 | – 28.9% | 4,138 | – 17.6% | 230 | 230 |
| 231 | Lucid Air | 1,200 | + 50.0% | 2,300 | + 5.0% | 250 | 249 |
| 232 | BMW 8-Series | 1,183 | – 11.5% | 4,058 | – 7.4% | 231 | 232 |
| 233 | Alfa Romeo Tonale | 1,122 | + 50.4% | 2,737 | + 217.1% | 241 | 264 |
| 234 | Mercedes S Class | 1,061 | – 72.7% | 5,846 | – 41.8% | 219 | 191 |
| 235 | Land Rover Discovery | 1,000 | + 18.2% | 2,273 | + 50.3% | 252 | 256 |
| 236 | Chrysler 300 | 978 | – 75.3% | 4,669 | – 58.2% | 226 | 185 |
| 237 | Genesis G80 | 973 | – 28.3% | 3,103 | – 27.6% | 236 | 233 |
| 238 | Subaru BRZ | 909 | + 7.1% | 2,323 | – 30.9% | 249 | 242 |
| 239 | Jaguar i-Pace | 900 | + 1243.3% | 2,125 | + 540.1% | 258 | 295 |
| 240 | Infiniti QX55 | 882 | – 37.8% | 2,736 | – 32.8% | 242 | 235 |
| 241 | Porsche Panamera | 852 | – 26.7% | 2,527 | – 20.8% | 244 | 241 |
| 242 | Toyota Supra | 834 | + 75.2% | 2,329 | + 11.1% | 248 | 253 |
| 243 | Genesis GV60 | 772 | – 14.0% | 1,998 | – 9.9% | 261 | 246 |
| 244 | Mercedes EQS SUV | 748 | – 53.1% | 4,170 | – 42.3% | 229 | 216 |
| 245 | Mercedes AMG GT | 740 | + 61.6% | 2,492 | + 29.0% | 246 | 265 |
| 246 | Nissan Z | 718 | + 109.3% | 2,175 | + 66.2% | 254 | 271 |
| 247 | BMW X2 | 706 | + 1917.1% | 2,164 | + 1129.5% | 255 | 301 |
| 248 | Land Rover Discovery Sport | 700 | + 37.8% | 1,435 | – 43.9% | 268 | 250 |
| 249 | Volvo V60 | 680 | + 70.0% | 2,102 | + 48.7% | 259 | 267 |
| 250 | Audi e-Tron GT | 673 | + 5.5% | 2,066 | – 14.8% | 260 | 248 |
| 251 | Maserati Truck | 625 | – 20.4% | 3,725 | + 17.7% | 233 | n/a |
| 252 | Ferrari car | 610 | – 9.6% | 2,130 | + 4.7% | 256 | 251 |
| 253 | Lamborghini Urus | 600 | + 9.1% | 1,546 | + 11.2% | 266 | 266 |
| 254 | Bentley Car | 550 | + 10.0% | 1,310 | – 16.6% | 271 | 259 |
| 255 | BMW Z4 | 543 | + 64.0% | 1,471 | + 1.2% | 267 | 268 |
| 256 | Volvo C40 | 530 | – 57.7% | 1,145 | – 80.2% | 276 | 228 |
| 257 | Alfa Romeo Stelvio | 499 | – 61.0% | 2,365 | – 41.3% | 247 | 237 |
| 258 | Lexus LS | 492 | – 4.3% | 1,706 | – 1.1% | 264 | 261 |
| 259 | Jeep Renegade | 450 | – 93.0% | 7,776 | – 50.0% | 204 | 136 |
| 260 | Chevrolet Camaro | 444 | – 94.0% | 5,750 | – 76.7% | 221 | 123 |
| 261 | Volvo S90 | 442 | + 32.7% | 998 | – 18.3% | 281 | 276 |
| 262 | Mercedes EQS | 440 | – 60.0% | 2,126 | – 63.1% | 257 | 227 |
| 263 | Jeep Cherokee | 435 | – 88.5% | 2,600 | – 88.7% | 243 | 141 |
| 264 | Lamborghini Huracan | 430 | – 4.4% | 980 | – 16.9% | 283 | 275 |
| 265 | Lexus RC | 429 | – 9.1% | 1,370 | + 4.3% | 270 | 273 |
| 266 | Alfa Romeo Giulia | 428 | – 50.4% | 1,724 | – 36.0% | 263 | 244 |
| 267 | McLaren Car | 400 | + 37.9% | 935 | + 11.3% | 284 | 282 |
| 268 | Audi A8 | 379 | – 50.9% | 1,232 | – 28.2% | 273 | 260 |
| 269 | Jaguar F-Type | 340 | + 19.3% | 910 | + 6.2% | 287 | 279 |
| 270 | Jaguar XF | 340 | + 69.2% | 895 | + 33.0% | 288 | 285 |
| 271 | Mercedes EQE | 333 | – 65.6% | 2,177 | – 52.6% | 253 | 239 |
| 272 | Lexus LC | 328 | – 35.2% | 1,294 | – 2.8% | 272 | 272 |
| 273 | Bentley Bentayga | 325 | – 18.8% | 1,130 | – 14.7% | 277 | 269 |
| 274 | Genesis G90 | 320 | + 0.3% | 1,017 | – 0.5% | 280 | 277 |
| 275 | BMW XM | 307 | – 30.7% | 1,385 | – 14.2% | 269 | 258 |
| 276 | Audi A7 | 303 | – 19.8% | 1,040 | – 15.7% | 279 | 270 |
| 277 | Aston Martin car | 283 | + 22.5% | 924 | + 37.3% | 285 | 286 |
| 278 | VW Arteon | 263 | – 61.5% | 1,187 | – 35.5% | 274 | 257 |
| 279 | BrightDrop Zevo | 246 | + 602.9% | 992 | + 197.9% | 282 | 296 |
| 280 | Fiat 500 | 235 | + 23400.0% | 439 | + 21850.0% | 292 | 315 |
| 281 | Mercedes SL Class | 233 | – 70.9% | 1,085 | – 60.6% | 278 | 245 |
| 282 | Rolls Royce car | 225 | + 78.6% | 530 | + 33.8% | 290 | 294 |
| 283 | Rolls Royce Cullinan | 175 | – 56.1% | 795 | – 21.6% | 289 | 278 |
| 284 | Chevrolet Bolt | 168 | – 98.9% | 8,582 | – 82.7% | 195 | 75 |
| 285 | Aston Martin DBX | 152 | – 33.9% | 501 | – 19.6% | 291 | 287 |
| 286 | Lotus car | 150 | + 1400.0% | 430 | + 437.5% | 293 | 305 |
| 287 | Maserati Car | 145 | – 25.6% | 1,145 | – 19.1% | 275 | n/a |
| 288 | Volvo V90 | 136 | + 30.8% | 395 | – 4.4% | 294 | 292 |
| 289 | Volvo EX90 | 109 | new | 109 | new | 302 | – |
| 290 | Nissan Maxima | 108 | – 95.7% | 920 | – 89.4% | 286 | 209 |
| 291 | Toyota Mirai | 101 | – 88.5% | 346 | – 86.7% | 296 | 252 |
| 292 | Ferraru Purosangue | 100 | new | 150 | new | 300 | – |
| 293 | Jaguar E-Pace | 90 | + 7.1% | 280 | – 27.5% | 298 | 297 |
| 294 | Fiat 500X | 81 | – 43.8% | 347 | – 17.8% | 295 | 293 |
| 295 | Audi Q6 e-tron | 44 | new | 44 | new | 307 | – |
| 296 | Audi R8 | 37 | – 80.4% | 303 | – 19.4% | 297 | 291 |
| 297 | Nissan GT-R | 34 | – 64.2% | 185 | – 40.7% | 299 | 298 |
| 298 | Toyota Grand Highlander | 28 | – 99.9% | 55,410 | + 127.3% | 64 | 91 |
| 299 | Hyundai Nexo | 12 | – 82.4% | 89 | – 48.6% | 303 | 300 |
| 300 | Volvo EX30 | 11 | new | 11 | new | 309 | – |
| 301 | Ram ProMaster City | 4 | – 99.8% | 49 | – 99.6% | 306 | 187 |
| 302 | Lexus GS | 4 | n/a | 4 | + 300.0% | 311 | 325 |
| 303 | Infiniti Q60 | 3 | – 98.6% | 51 | – 94.6% | 305 | 283 |
| 304 | Toyota Avalon | 3 | – 66.7% | 8 | – 84.6% | 310 | 309 |
| 305 | Lexus TX | 1 | new | 21,323 | new | 128 | 220 |
| 306 | Kia Rio | 1 | – 100.0% | 1,917 | – 91.0% | 262 | 135 |
| 307 | Dodge Dart | 1 | n/a | 1 | n/a | 317 | 324 |
Source: Manufacturers